deBridge Price Prediction Sept 2026: Can DBR Finally Recover?


The desk take on DBR this week is simple: the token has spent months bleeding lower inside a descending channel, and it has now arrived at the level where that story either changes or repeats itself.
Price has tested support and tapped the channel's upper boundary in the same stretch, putting the setup squarely in decision-point territory.
This deBridge price prediction Sept 2026 runs through the price action, the balance sheet, and the derivatives flow to lay out what the desk is watching from here.
Price Action: Where DBR Stands
DBR is marked at $0.01455, down about 2.99% on the day, according to CoinMarketCap data.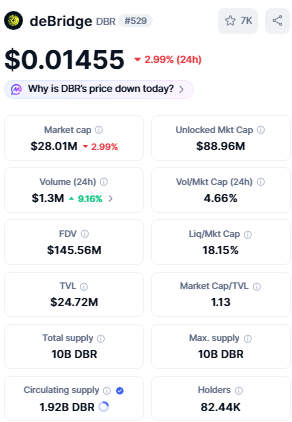
Turnover sits at $1.3 million over 24 hours, up 9.16%, putting the volume-to-market-cap ratio at 4.66%, thin enough to call this a consolidation tape rather than a market with conviction in either direction.
Market capitalization is running near $28.01 million, down roughly 2.99% on the day, against a fully diluted valuation of $145.56 million, a wide gap that keeps future supply firmly on the desk's radar for this deBridge price prediction Sept 2026.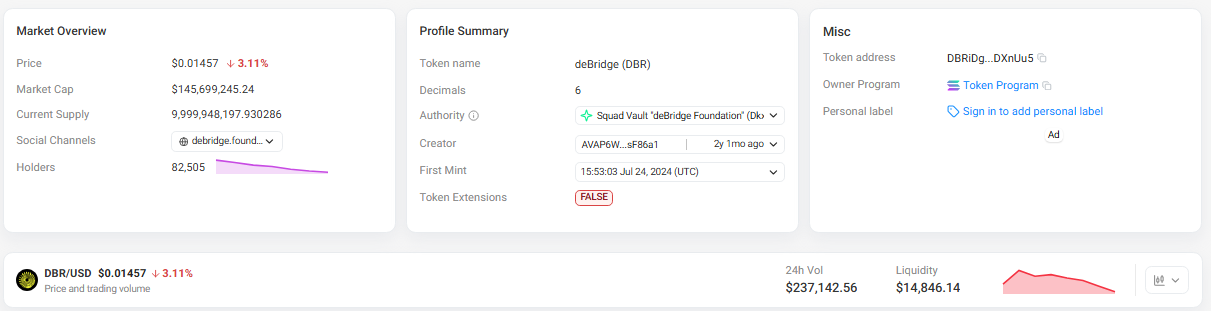
Total and max supply are fixed at 10 billion DBR, with 1.92 billion currently in circulation across more than 82,000 holders, per on-chain token data on Solscan. Protocol TVL stands at $24.72 million, putting the market cap-to-TVL ratio at 1.13 a reading that shows the market isn't pricing DBR much above the value actually locked in the protocol.
Technical Read: The Weekly Setup
On the weekly chart, DBR remains inside a descending channel, with the tape recently testing support at $0.01248 and pressing into the channel's upper trendline, per the TradingView chart.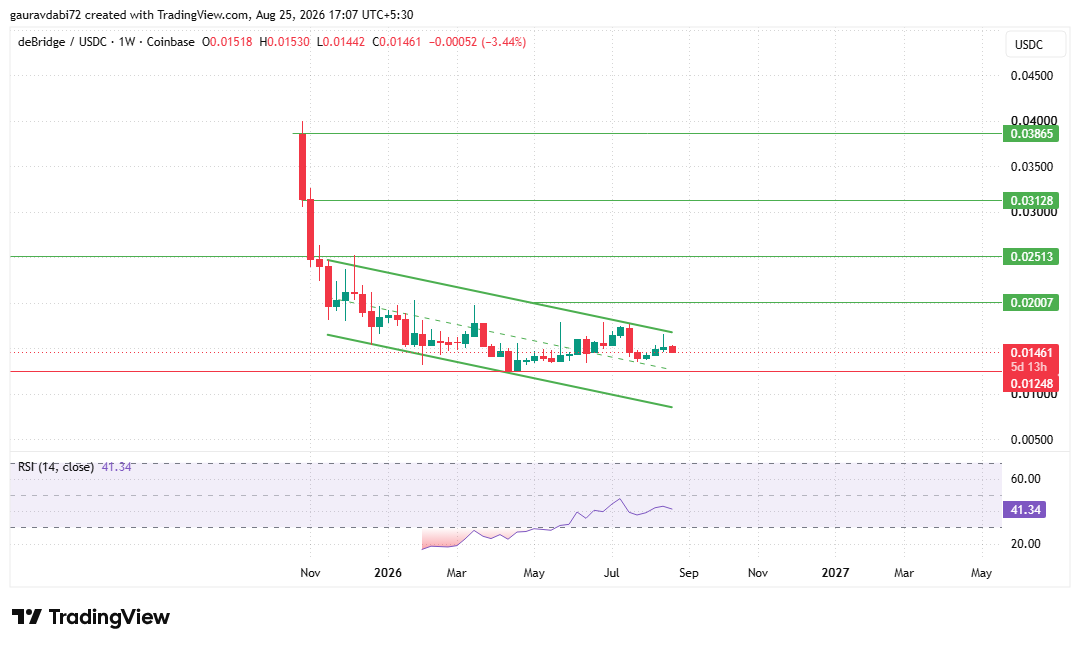
A weekly close that holds above the channel is the confirmation the desk would need to call this a genuine trend reversal rather than a bounce inside a broader downtrend.
Resistance sits at $0.02007, $0.02513, $0.03128 and $0.03865, with support anchored at $0.01248. Weekly RSI reads near 41 — below the midline, which keeps the desk cautious on calling this move a confirmed reversal just yet.
Positioning and Flows
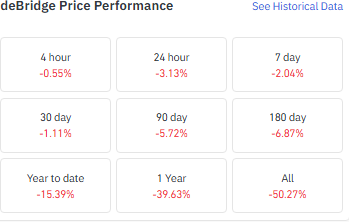
DBR is off 2.04% over 7 days and 1.11% over 30 days, with steeper drawdowns of 5.72% over 90 days, 6.87% over 180 days, 15.39% year to date, and 50.27% across its full trading history, a book that's still net negative on every longer horizon even as the near-term tape stabilizes.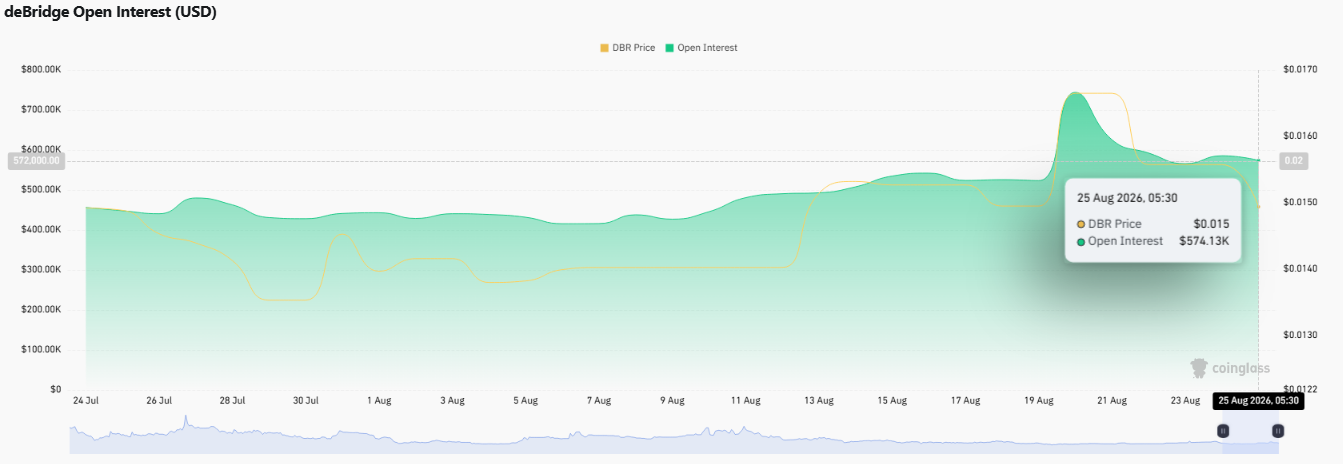
On the derivatives side, Coinglass data shows open interest at $574.13K as of August 25, 2026, unwinding from a spike above $770K in mid-August.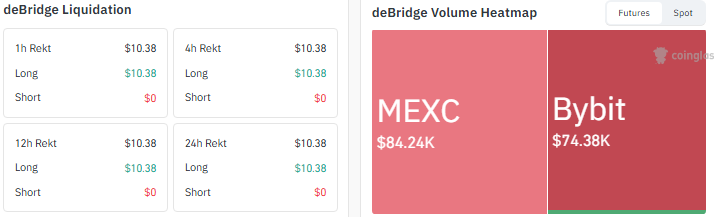
Liquidation flow has been negligible, with just $10.38 wiped out over 24 hours, entirely from a single long.
Futures turnover on the volume heatmap was concentrated on MEXC at $84.24K and Bybit at $74.38K.
Scenario Grid: What Could Move DBR Next
The table below is how the desk is framing this DBR price prediction 2026 from current levels.
Scenario | Trigger | Key Levels to Watch |
Bullish | Weekly candle closes and holds above the descending channel trendline | Can go to $0.02007, then $0.02513, $0.03128 and $0.03865 |
Bearish | Price fails to hold the channel breakout attempt and slips back toward support | $0.01248 |
Neutral | DBR holds above $0.01248 but stays below $0.02007 while the channel breakout awaits confirmation | Range-bound trade between roughly $0.01248 and $0.02007 |
Desk View: The Overall Outlook for DBR
The CoinGabbar analyst desk reads DBR's push into the channel's upper trendline, alongside cooling open interest and near-zero liquidation flow, as a market probing higher cautiously rather than reversing outright.
The case for this deBridge price prediction Sept 2026 still hinges on a confirmed weekly close above the descending channel before the can-go-to levels toward $0.02007 and beyond move from a watch-list item to a base-case scenario.
Disclaimer: This article is for informational purposes only and should not be treated as financial, investment, or trading advice. Cryptocurrency markets, including deBridge (DBR), are highly volatile, and prices can change rapidly based on market conditions. Readers are encouraged to conduct their own research and consult a qualified financial advisor before making any investment decisions.
Also read:

















