eCash Price Prediction: $XEC Aster Listing Sparks Rally, Next Target?


XEC is buzzing across trading communities right now, with fresh attention building after a major exchange listing dropped overnight.
eCash positions itself as a fast, low-fee digital cash network built on Bitcoin-style technology, designed to scale for everyday payments, according to the project's own materials.
This eCash Price Prediction looks at what this listing-driven rally could mean for XEC going forward. Stick around till the end to see what the charts are hinting at next.
eCash Price Prediction: XEC price today: Market Overview
Metric | Value |
Current Price | $0.00000801 |
24h Change | -6.7% |
24h Range | $0.00007786 - $0.00008877 |
7 Day Change | +31.9% |
All Time High | $0.0003800 (-97.80%) |
Market Cap | $159.386M |
Fully Diluted Valuation | $159.386M |
24h Trading Volume | $35.387M |
Circulating Supply | 20.058T XEC |
Total Supply | 20.058T $XEC |
Max Supply | 21T $XEC |
Source: Data from CoinGecko as of 20/07/2026. Figures may vary slightly across other tracking websites.
XEC Liquidation and Volume Data: eCash price forecast
Liquidation volume is minimal right now, and every single liquidation across all four windows sits on the short side.
This tells a simple story: short sellers have been getting squeezed as the price is pushed higher, though the total dollar amount is too small to call it a major driver of the move.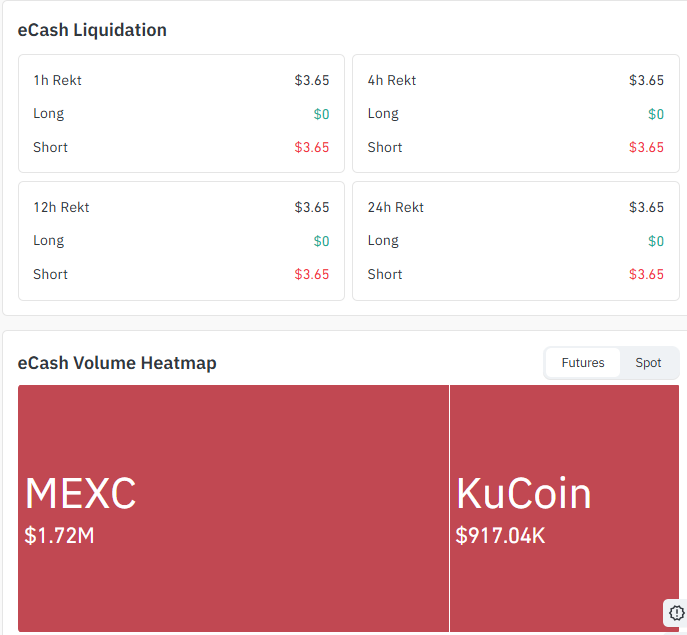
Source: Data From CoinGlass
Futures Volume by Exchange: MEXC leads with $1.72M, followed by KuCoin at $917.04K.
This futures volume is separate from the $35.387M spot trading volume reported by CoinGecko in the market overview table above.
The two should not be combined, since they measure different markets.
Timeframe | Total Liquidated | Long | Short |
1h | $3.65 | $0 | $3.65 |
4h | $3.65 | $0 | $3.65 |
12h | $3.65 | $0 | $3.65 |
24h | $3.65 | $0 | $3.65 |
XEC price prediction 2026: Why Is eCash Price Rallying Today
The biggest driver behind this XEC crypto rally is a fresh exchange listing, not random speculation.
Aster DEX has gone live with $XEC perpetuals, offering traders up to 5x leverage on the token, with support directly from eCash itself. This kind of listing tends to pull in new trading volume fast, since it opens up a leveraged trading venue that did not exist for XEC before.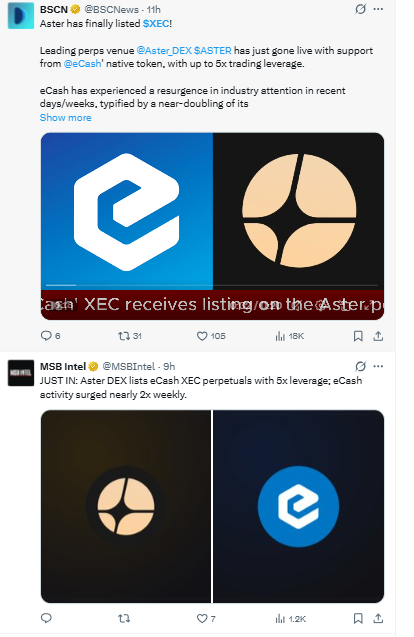
Source: Data From X
Alongside the listing, reports point to eCash activity nearly doubling on a weekly basis.
That combination, a new leverage venue plus a genuine pickup in network activity, explains why $XEC has managed a 31.9% weekly gain while most of the liquidation pressure has landed on short sellers rather than longs.
XEC price prediction 2026: XEC Price Chart Analysis (4H)
$XEC has been in a clear uptrend since around July 13, with a rising trendline acting as support under the whole move. Price pushed hard into resistance before cooling off, and the current pullback has it trading just under both short-term moving averages.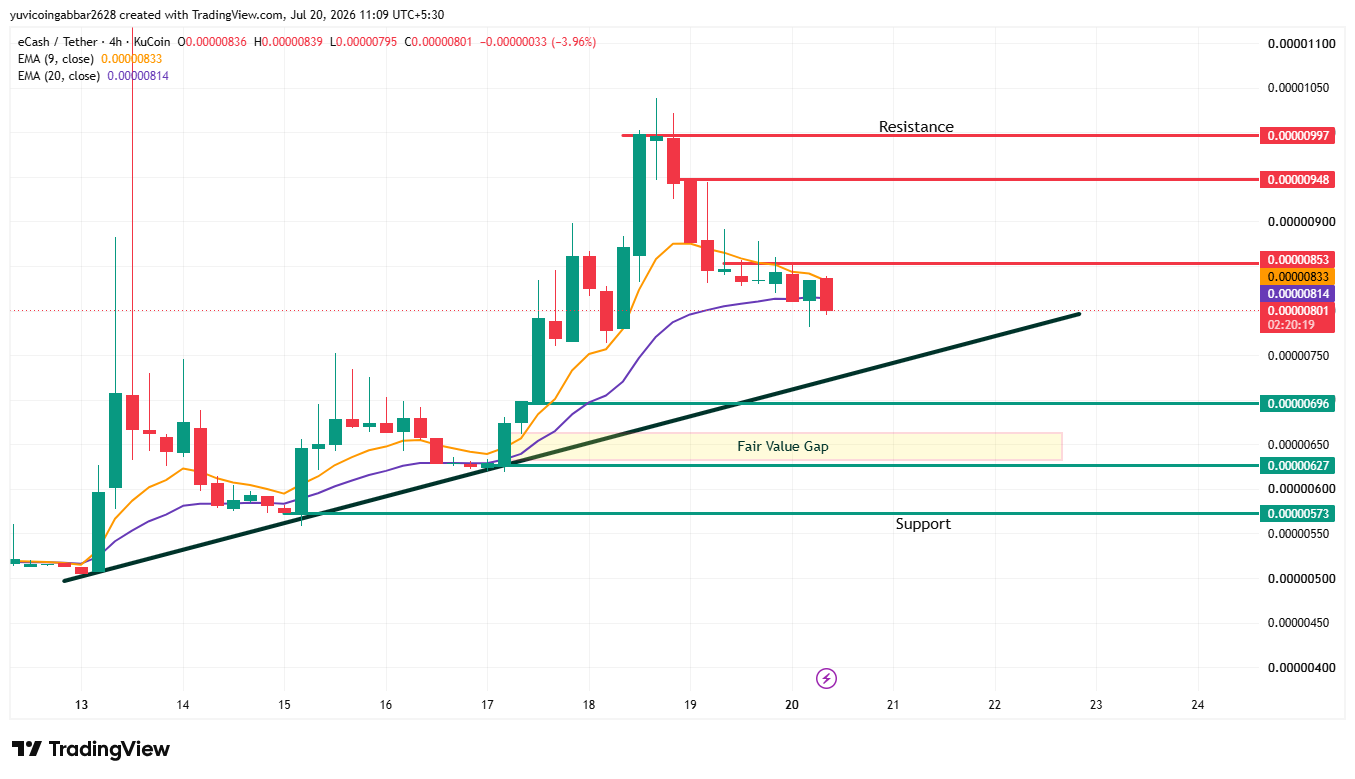
EMA 9 is at 0.00000833 and EMA 20 is at 0.00000814, with the price now sitting around 0.00000801, down close to 6.5% on the day.
If XEC closes below both the 9 EMA and 20 EMA, with a bearish crossover confirming weakness, the price could retest the rising trendline.
As long as the trendline holds, buyers may attempt another move toward the immediate resistance at $0.00000853.
A successful breakout above this level could open the door to higher resistance zones.
However, if the trendline fails, the next key support sits at $0.00000696, followed by the Fair Value Gap around $0.00000633, where buyers may look to step back in.
Level Type | Price |
Resistance | $0.00000997 |
Resistance | $0.00000948 |
Resistance (closer) | $0.00000853 |
EMA 9 | $0.00000833 |
EMA 20 | $0.00000814 |
Support | $0.00000696 |
Support | $0.00000627 |
Support | $0.00000573 |
Fair Value Gap | $0.00000633 |
Two Reader Takeaways
For existing holders, the level to watch is the EMA 20 at 0.00000814. Holding above this on a close basis keeps the short-term structure intact.
For anyone considering an entry, the fair value gap zone between 0.00000633 and 0.00000663 is the area that would offer a better risk-to-reward setup if price pulls back that far, rather than chasing the current level.
eCash Market Outlook: Expert View
According to CoinGabbar analysts, the setup right now favors continuation over breakdown as long as the rising trendline holds.
A bullish trigger for a further eCash price rally would be a reclaim of the EMA 9 and a push back toward the $0.00000853 and then the next $0.00000948 resistance.
A bearish trigger would be a close below the EMA 20 that opens the door toward the fair value gap zone, which would still keep the broader uptrend technically alive given the trendline support underneath.
















