Zcash Price Prediction: $ZEC Next Big Move Is Loading


Zcash Price Prediction: What's Going On
Zcash price prediction searches have picked up fast this week, and it's not hard to see why.
ZEC just took a sharp knock lower after running up strongly, and now it's sitting at a spot where the next move could go either way.
Big positions are getting squeezed out, trading activity across major exchanges is heavy, and one well-known trader is already talking targets north of $600.
So is this pullback just a pause before ZEC pushes higher, or the start of something rougher?
That comes down to a couple of key lines on the chart. Here's what the price action, the liquidations, and the trading data are actually showing.
Current Market Snapshot
| Metric | Value |
|---|---|
| Price | $529.65 (-5.28% 24h) |
| Market Cap | $8.88B (-5.27%) |
| 24h Volume | $386.1M (+11.56%) |
| Vol/Mkt Cap | 4.34% |
| FDV | $11.12B |
| Total Supply | 16.78M ZEC |
| Max Supply | 21M ZEC |
| Circulating Supply | 16.78M ZEC |
The price dropped over 5% on the day, but volume actually climbed more than 11%.
That combination of a price falling while trading picks up usually means real selling pressure, not just a quiet drift lower.
Liquidation Heatmap: Longs Under Real Pressure
The liquidation heatmap over the past day makes the story pretty clear: this pullback caught a lot of buyers leaning the wrong way.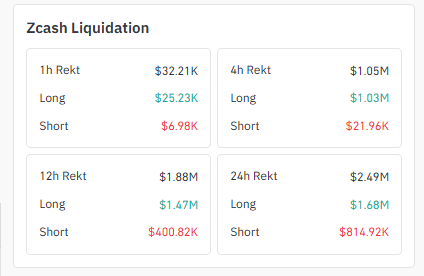
Source: liquidation data taken from Coinglass
| Timeframe | Total Rekt | Longs | Shorts |
|---|---|---|---|
| 1h | $32.21K | $25.23K | $6.98K |
| 4h | $1.05M | $1.03M | $21.96K |
| 12h | $1.88M | $1.47M | $400.82K |
| 24h | $2.49M | $1.68M | $814.92K |
That 4-hour window is the standout $1.03M in long liquidations against barely $22K on the short side.
Whatever triggered this drop, it happened fast enough that a lot of leveraged buyers didn't have time to react.
Exchange Volume Heatmap
Exchange volume for ZEC is heavily concentrated on a few major venues, with Binance running well ahead of everyone else: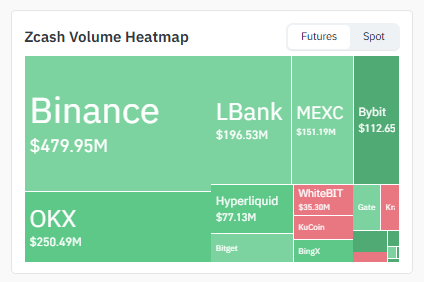
Source: Heatmap Data Taken From Coinglasss
| Exchange | 24h Futures Volume |
|---|---|
| Binance | $479.95M |
| OKX | $250.49M |
| LBank | $196.53M |
| MEXC | $151.19M |
| Bybit | $112.65M |
| Hyperliquid | $77.13M |
| WhiteBIT | $35.38M |
Smaller volume is also showing up on Bitget, KuCoin, BingX, Gate, and a few others.
Binance alone is handling close to a third of all tracked futures activity, so moves there tend to set the tone for the rest of the market.
4-Hour Chart: Descending Channel Pointing Down
The 4-hour chart shows ZEC stuck inside a clearly marked descending channel, with lower highs and lower lows both sliding down together since the recent top.
Price is currently sitting near $530, right around the middle-to-lower part of that channel.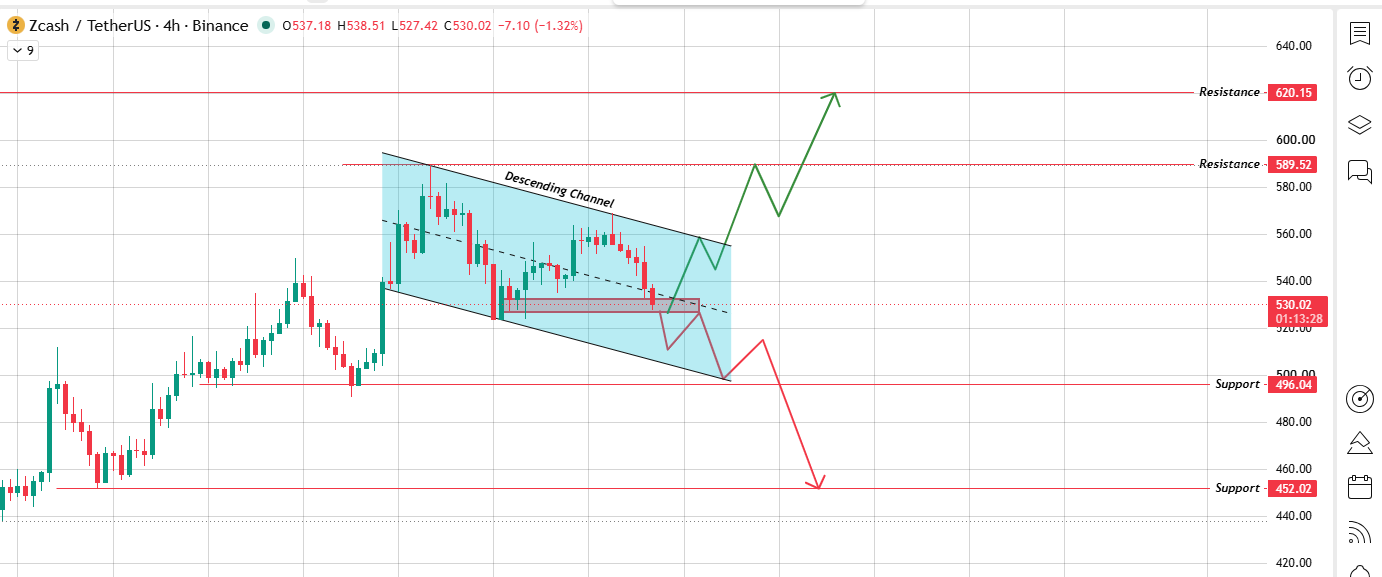
Source: Chart Taken From TradingView
Resistance level 1: $589.52
Resistance level 2: $620.15
Support zone 1: $496.04
Support zone 2: $452.02
A move back above the channel's upper line, clearing $589.52, would count as a bullish breakout, with $620.15 as the next stop if buyers keep pushing.
But if the channel holds its current direction and price keeps sliding, that's a bearish breakdown setup. The first stop would be $496.04, and a deeper slide could reach $452.02.
1-Day Chart: Symmetrical Triangle Tightening Up
Widen out to the daily chart, and ZEC is working inside a symmetrical triangle, the highs stepping down and the lows stepping up, both converging toward roughly the same zone price that is sitting in right now, near $528.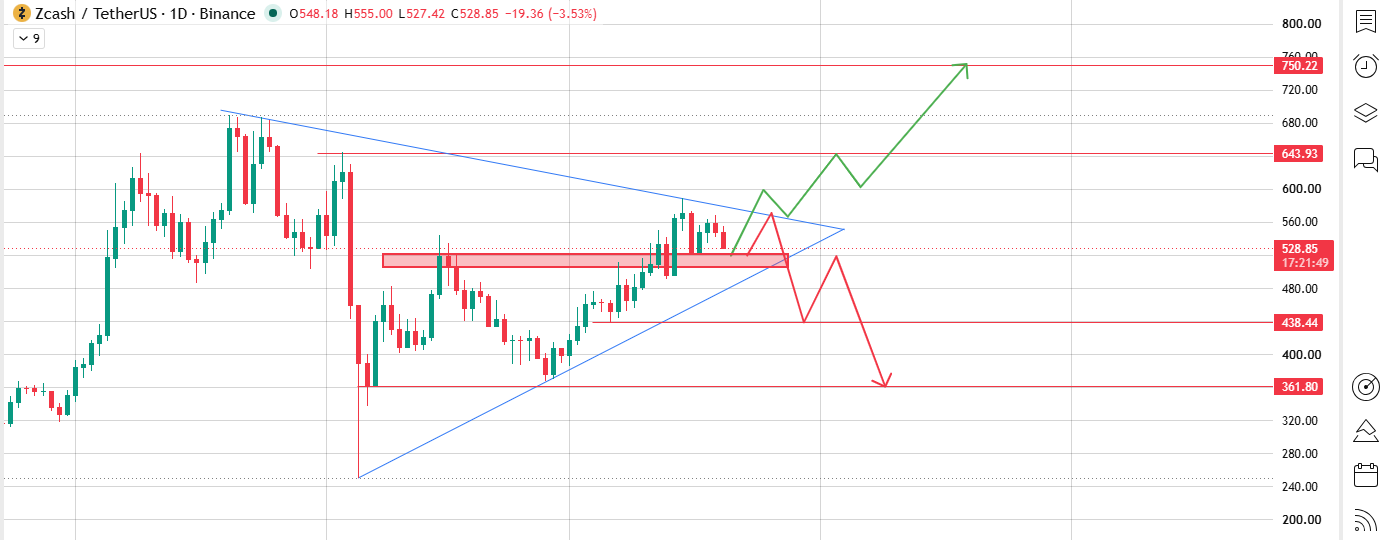
Source: Chart Taken From TradingView
-
Long-term breakout resistance level : $643.93 $750.22
-
Long-term breakdown support zone : $438.44 $361.80
Clear the triangle to the upside with a solid daily close, and $643.93 comes into view first, with $750.22 as the extended target if the move has legs. Break down instead, and $438.44 is the first real support to watch, with $361.80 as the deeper level if things get messier from there.
Social Sentiment: What Traders Are Saying
Trader Altcoin Sherpa summed up the current mood well in a recent post, saying ZEC still probably grinds toward $650 over time, but as a trade it's getting less appealing at these levels.
The post also flagged that ZEC's move is closely tied to Bitcoin's own direction and that the trader is staying patient rather than chasing an entry right here.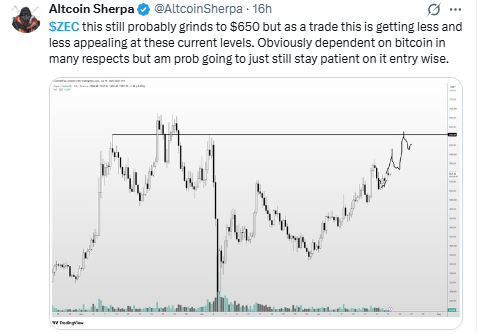
That $650 figure actually lines up well with the technical picture; it sits just above the daily chart's $643.93 breakout target, which is a useful cross-check.
Unlike some speculative dollar-plus meme coin targets, this one isn't asking for anything unrealistic.
At $650, ZEC's market cap would land around $10.9 billion, which is actually a bit below its current fully diluted value of $11.12 billion. In other words, the math behind this target holds up.
Watching Zcash whale activity around these levels can add further confirmation as sentiment develops.
Three-Scenario Outlook
| Scenario | Short-Term (4H) Target | Long-Term (1D) Target |
|---|---|---|
| Bullish | $589.52 $620.15 | $643.93 $750.22 |
| Neutral / Range | Drifting inside the channel near $530 | Coiling inside the triangle near $528 |
| Bearish | $496.04 $452.02 | $438.44 $361.80 |
Technical vs. Sentiment Targets Compared
| Source | Time Frame | Target Range |
|---|---|---|
| 4H Chart (Descending Channel) | Short-term | $452.02 – $620.15 |
| 1D Chart (Symmetrical Triangle) | Medium-term | $361.80 – $750.22 |
| Social Sentiment (Trader Target) | Medium/Long-term | ~$650 |
The sentiment target sits comfortably inside the technical range here, which isn't always the case.
That alignment gives the $650 price target a bit more weight than a figure pulled purely from social media chatter usually gets.
BTC Dominance and BTC Correlation Context
ZEC has been trading with a tight link to Bitcoin lately, and that's not just chart-watcher talk; it showed up directly in the trader sentiment above too.
BTC dominance shifts tend to decide how much capital rotates into privacy-focused coins like ZEC, and ZEC's BTC correlation means a sharp bitcoin move, up or down, often shows up in ZEC's price shortly after.
Both are worth checking before leaning too hard on any single Zcash price prediction.
Final Outlook
ZEC pulling back sharply into both a descending channel and a tightening daily triangle is a setup that needs confirmation before picking a side.
The heavy long liquidations over the past 24 hours show plenty of buyers already got caught off guard, so a real recovery needs a clean move back above $589.52 short-term or $643.93 long-term to shift momentum.
Until that happens, $496.04 down to $452.02 is the zone to watch if the slide continues.
With bitcoin dependency this high right now, keeping an eye on broader market direction matters just as much as ZEC's own chart.
Glossary
The descending channel price is moving down inside two parallel lines, with both the highs and lows sliding lower together. Signals ongoing downward pressure until the price breaks out of it.
Symmetrical triangle highs and lows converging toward the same point, which usually means a breakout is coming, just not in which direction yet.
A resistance level is a price ceiling that's capped rallies before, and a support zone is the floor that's held declines in the past two sides of the same idea.
The liquidation heatmap shows where leveraged trades are getting force-closed and how one-sided the pain is. Exchange volume is more straightforward; it's just the total trading activity for a coin, added up across every exchange it trades on.
Two more worth knowing here: BTC dominance measures Bitcoin's share of the total crypto market and BTC correlation describe how closely another coin's price tends to move alongside Bitcoin's own swings.
Methodology
Every chart level in this Zcash price prediction is taken directly from the uploaded 4H and 1D TradingView charts; nothing is extrapolated.
Liquidation and exchange volume numbers come from live derivatives dashboards.
The social sentiment target is quoted from a public trader post and checked against the technical range rather than treated as a standalone number.
Reflects market conditions as of July 20, 2026. Informational only, not financial advice.
Disclaimer: This article is informational commentary based on publicly available market data. It is not financial, investment, or trading advice, and the author is not a licensed financial advisor. Cryptocurrency prices are volatile and can move sharply within hours. Verify all figures against a live source and consult a licensed professional before making financial decisions.
Also read:
















