EigenLayer Price Prediction September 2026: EIGEN Outlook


This EigenLayer price prediction September 2026 centers on a pattern that has been quietly tightening for months.
EIGEN has been coiling inside a shrinking triangle, and the way price behaved on its most recent test of the upper boundary is different from what came before.
Instead of rolling over the way it usually does, price held its ground without carving a fresh low, a small but telling shift that has traders watching this setup much more closely. Here is the full picture.
EIGEN Price Today: Live Data and 24-Hour Change
EIGEN is trading near $0.2038 on the weekly chart, coming off a weekly candle that opened near $0.2304, reached a high of $0.2327, dipped to a low of $0.1944, and closed at $0.2038, down 11.51% for the week.
Broader market data shows EigenLayer around $0.2047, down close to 1.25%, with futures volume of $35.19 million against spot volume of $4.91 million and open interest sitting near $30.85 million.
Market capitalization stands at roughly $285.07 million on a circulating supply of 1.77 billion EIGEN, with no fixed max supply currently listed.
Source: TradingView, EIGEN/USDT perpetual, 1-week timeframe, Binance, and CoinGlass, both accessed August 27, 2026, IST.
EIGEN Holder Concentration Data
Holder concentration data shows a market still heavily weighted toward its largest wallets.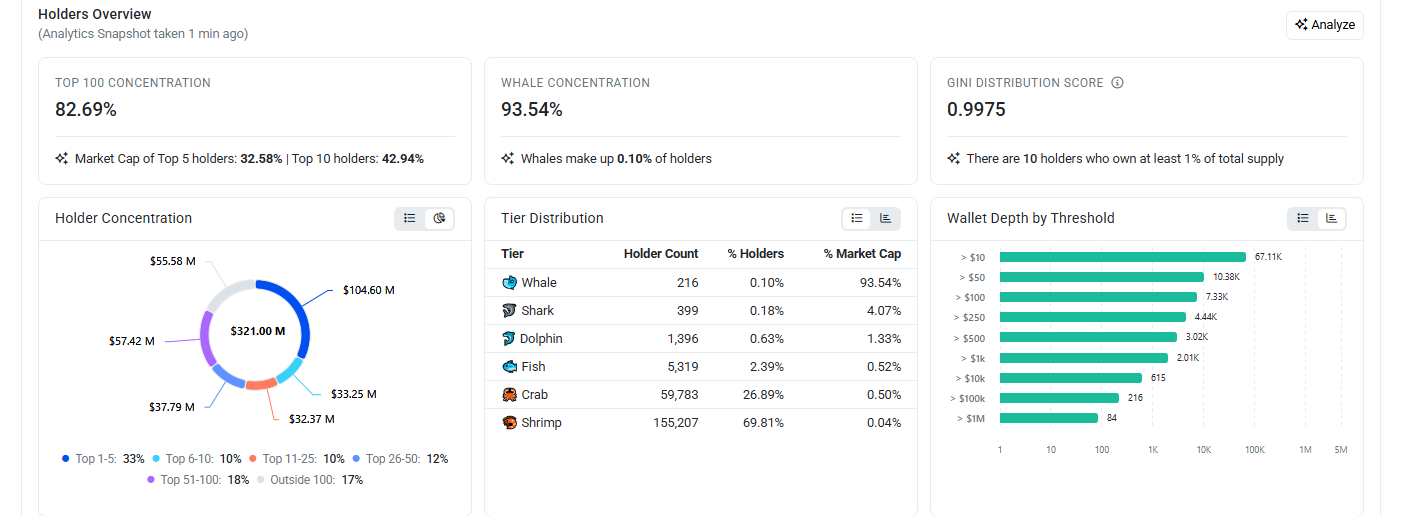
The top 100 holders control 82.69% of tracked supply worth roughly $321.00 million, with the top 5 alone accounting for 32.58% of market cap and the top 10 reaching 42.94%.
Whale-tier wallets, just 0.10% of all holders, control 93.54% of tracked value, and the Gini distribution score sits at 0.9975, reflecting just how concentrated ownership remains, with only 10 holders currently owning at least 1% of total supply each.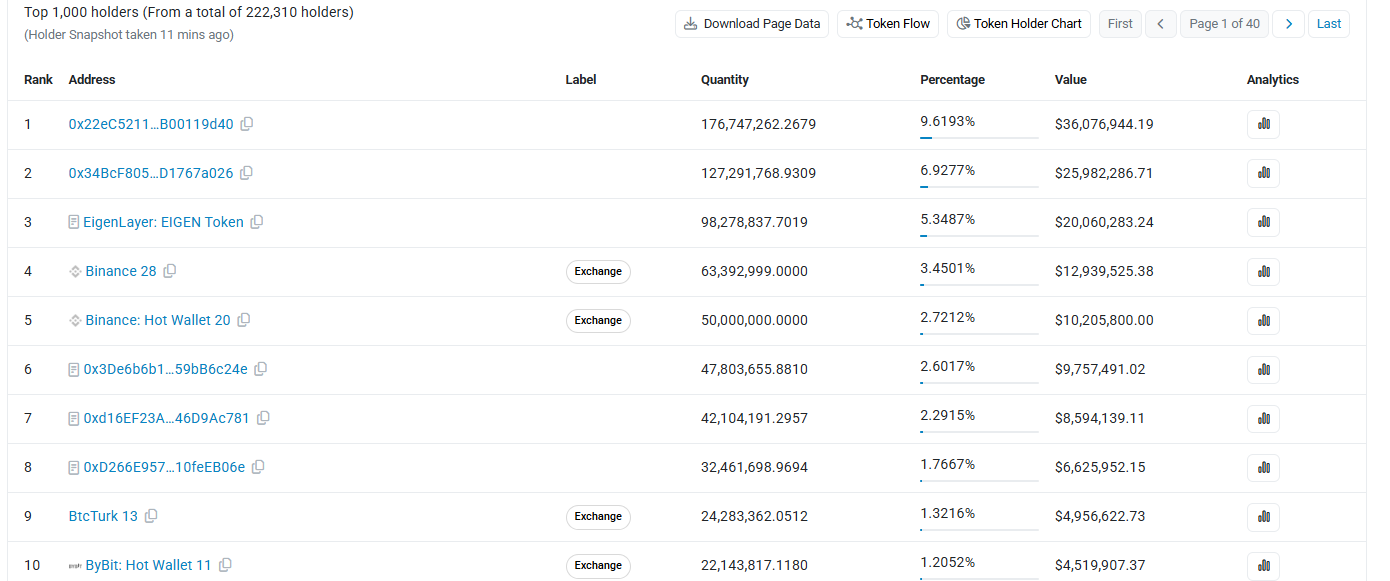
Looking at the actual top addresses, the largest wallet holds 9.62 percent of supply, followed by a second unlabeled wallet at 6.93 percent, then the EigenLayer token contract itself at 5%.
Exchange-tagged wallets also feature prominently further down the list, including Binance addresses holding a combined 6.17%, along with BTCTurk and ByBit hot wallets, each holding just over 1%.
This mix of unlabeled large wallets, the token contract, and multiple exchange custody addresses suggests concentration here is driven by a combination of early holders and exchange-held liquidity rather than a single project treasury, which is an important distinction when reading concentration numbers for EIGEN coin.
Source: Etherscan.io and on-chain holder analytics, accessed August 27, 2026.
Quick Take
-
CMP: $0.2038
-
Weekly trigger: close above $0.3156 confirms the symmetrical triangle breakout, opening $0.6603, then $1.0000
-
Weekly failure: close below $0.1472 invalidates the bullish structure
-
Data as of August 27, 2026, IST
-
Short risk note: these levels come from the weekly chart and depend on confirmed weekly closes, not intraday wicks. Leveraged positions around these zones carry liquidation risk if price whipsaws before a level is confirmed.
EigenLayer Technical Forecast September 2026
EIGEN has spent the past several months compressing inside a symmetrical triangle, with a descending upper trendline connecting a series of lower highs meeting an ascending lower trendline built from a series of higher lows.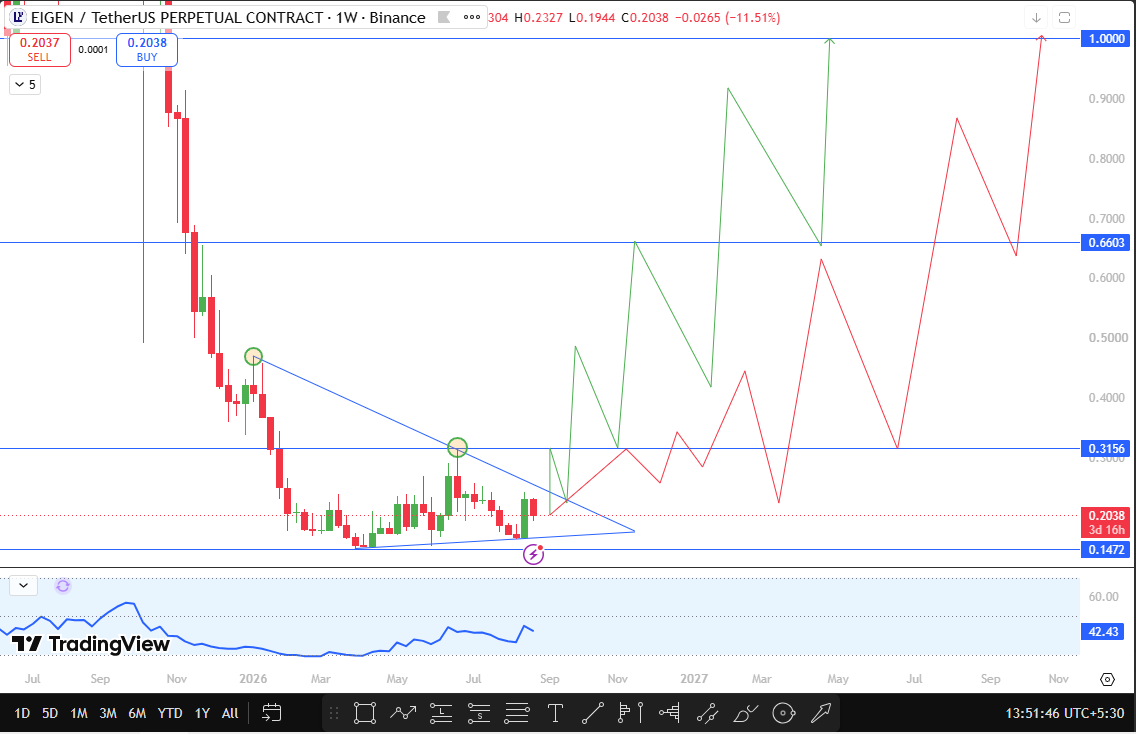
The pattern has been narrowing steadily, and price is now trading close to the apex where these two lines converge, typically the point where a triangle resolves one way or the other.
What stands out on the most recent retest of the upper trendline is that price failed to make a fresh low on the pullback that followed, unlike earlier retests in this same pattern.
That kind of behavior, holding structure rather than sliding to a new low, often signals that sellers are losing conviction even before the breakout itself occurs, and it is one of the earlier tells that a bullish shift may be building beneath the surface.
If EIGEN closes a weekly candle above $0.3156, that would confirm the symmetrical triangle breakout and mark a genuine shift in price action toward the bullish side.
From there, this EigenLayer technical analysis in September 2026 views $0.6603 as the next resistance, an old swing high from earlier in the decline.
Clearing that opens the door toward the psychological $1.0000 level, a round number that would represent a major milestone for this EIGEN price forecast for September 2026 if the breakout follows through.
On the downside, this setup stays intact as long as EIGEN holds above $0.1472.
A weekly close below that level would invalidate the bullish structure entirely, suggesting the triangle has resolved to the downside instead and the broader downtrend remains in control.
As with the upside targets, this support level comes directly from an old swing low on the chart rather than an arbitrary number.
Source: TradingView, EIGEN/USDT perpetual chart, 1-week timeframe, Binance, captured August 27, 2026, IST.
EIGEN Support and Resistance Levels to Watch
| Level Type | Price | Change from CMP | Note |
| Support | $0.1472 | -27.77% | Old swing low; weekly close below this invalidates the bullish setup |
| Resistance | $0.3156 | +54.86% | Upper triangle trendline and recent lower high; weekly close above this confirms breakout |
| Resistance | $0.6603 | +223.99% | Old swing high, first major target after breakout |
| Resistance | $1.0000 | +390.68% | Major psychological resistance and upside target |
EigenLayer Price Prediction: Bull, Base, and Bear Cases
The base case has EIGEN continuing to compress near the triangle's apex through much of September, without yet confirming a decisive weekly close through $0.3156 or below $0.1472.
The bull case activates on a weekly close above $0.3156, confirming the symmetrical triangle breakout and opening a path first toward $0.6603 and eventually the psychological target at $1.0000.
This EIGEN breakout prediction for the September 2026 case is supported by the failure to print a fresh low on the most recent trendline retest, a subtle but meaningful shift in price behavior compared with earlier tests of the pattern.
The bear case needs a weekly close below $0.1472, which would mean the triangle has resolved downward instead, putting a retest of deeper lows back in focus and suggesting the broader downtrend that shaped this chart since the token's launch remains in control.
On-Chain and Fundamental Drivers
EigenLayer's role as a restaking protocol ties EIGEN's long-term relevance to activity across its ecosystem of actively validated services, giving the token a use case tied to network security demand rather than pure speculation alone. The holder data here is also worth factoring in.
With whale-tier wallets controlling over 93 percent of tracked value and a Gini score close to 1, EIGEN's price action can be disproportionately influenced by decisions from a relatively small group of large holders, including the exchange-custody wallets identified among the top ten addresses.
That concentration profile means renewed accumulation or distribution from any of these large wallets could meaningfully affect this EigenLayer price outlook for September 2026 independent of broader market conditions.
September 2026 Catalysts
The most immediate catalyst for EIGEN is whether the market can convert this pattern into a confirmed weekly close above $0.3156 in the coming weeks.
Beyond the chart itself, activity from the large unlabeled and exchange-tagged wallets identified in the holder data, broader restaking and liquid staking sector sentiment, and general crypto market liquidity conditions could all meaningfully influence this EIGEN price target for September 2026.
Risks to This EigenLayer Outlook
The primary risk to this bullish thesis is that the triangle resolves to the downside instead, something the pattern's tightening structure makes increasingly likely to happen decisively in either direction soon.
A weekly close below $0.1472 would confirm that scenario. Broader risks include large wallet movements from the concentrated top holders shown in the concentration data, a slowdown in restaking sector activity, and general crypto market volatility, any of which could override EIGEN's own chart structure regardless of where its technical levels sit.
How to Buy and Store EigenLayer
EIGEN can be purchased on major exchanges through spot or futures markets, with Binance, ByBit, and BtcTurk among the platforms offering active EIGEN pairs based on current exchange holdings.
For long-term holding, moving EIGEN into a non-custodial wallet remains standard security practice, while active traders may prefer to keep smaller amounts on exchange for liquidity around the key technical levels outlined above.
Glossary
Symmetrical triangle: a chart pattern formed by a descending upper trendline and an ascending lower trendline converging toward an apex, typically resolving in a breakout
Trendline breakout: a move where price closes beyond a trendline that had previously capped upside
Weekly close: the final traded price when a weekly candle finishes, used to confirm whether a breakout or breakdown is genuine
Restaking: a mechanism allowing staked assets to secure additional protocols beyond their base network, extending their economic security
Support: a price zone where buying pressure has previously stepped in
Resistance: a price zone where selling pressure has previously capped upside
Invalidation level: the price point at which a forecast scenario is considered incorrect
Disclaimer
This article is for informational purposes only and does not constitute financial advice. Cryptocurrency markets are highly volatile, and all price levels discussed are based on technical chart analysis, not a guarantee of future performance. Readers should conduct their own research before making any investment decisions.
Also read:

















