Ethereum Classic Price Prediction September 2026: ETC Outlook


This Ethereum Classic price prediction September 2026 comes at a point where a very long slide finally seems to be losing its grip.
A descending trendline that has capped ETC for well over a year has just been sustained above, and the way price has behaved since suggests this is not a quick wick through the line.
What has followed is a market that looks like it is finally shaking off months of dead weight. Here is the full picture.
ETC Price Today: Live Data and 24-Hour Change
ETC is trading near $7.900 on the weekly chart, coming off a weekly candle that opened at $7.944, reached a high of $8.099, dipped to a low of $7.467, and closed at $7.900, down a modest 0.55 percent for the week.
Broader market data shows Ethereum Classic around $7.824, up close to 0.64 percent, with futures volume of $86.39 million against spot volume of $11.79 million and open interest sitting near $90.20 million.
Market capitalization stands at roughly $1.23 billion on a circulating supply of 157.97 million ETC, which is already close to the total and max supply of 210.70 million tokens.
Source: TradingView, ETC/USDT perpetual, 1-week timeframe, Binance, and CoinGlass, both accessed August 27, 2026, IST.
Quick Take
CMP: $7.900
Weekly trigger: close above $12.858 confirms the breakout, opening $25.977 and then $39.830
Weekly failure: close below $6.069 invalidates the bullish structure
Data as of August 27, 2026, IST
Short risk note: these levels come from the weekly chart and depend on confirmed weekly closes, not intraday wicks. Leveraged positions around these zones carry liquidation risk if price whipsaws before a level is confirmed.
Ethereum Classic Technical Forecast September 2026
$ETC has spent well over a year grinding lower under a steep descending trendline, one that traces all the way back from a swing high near $39.830 down through a lower high around $25.977 before finally reaching the current price.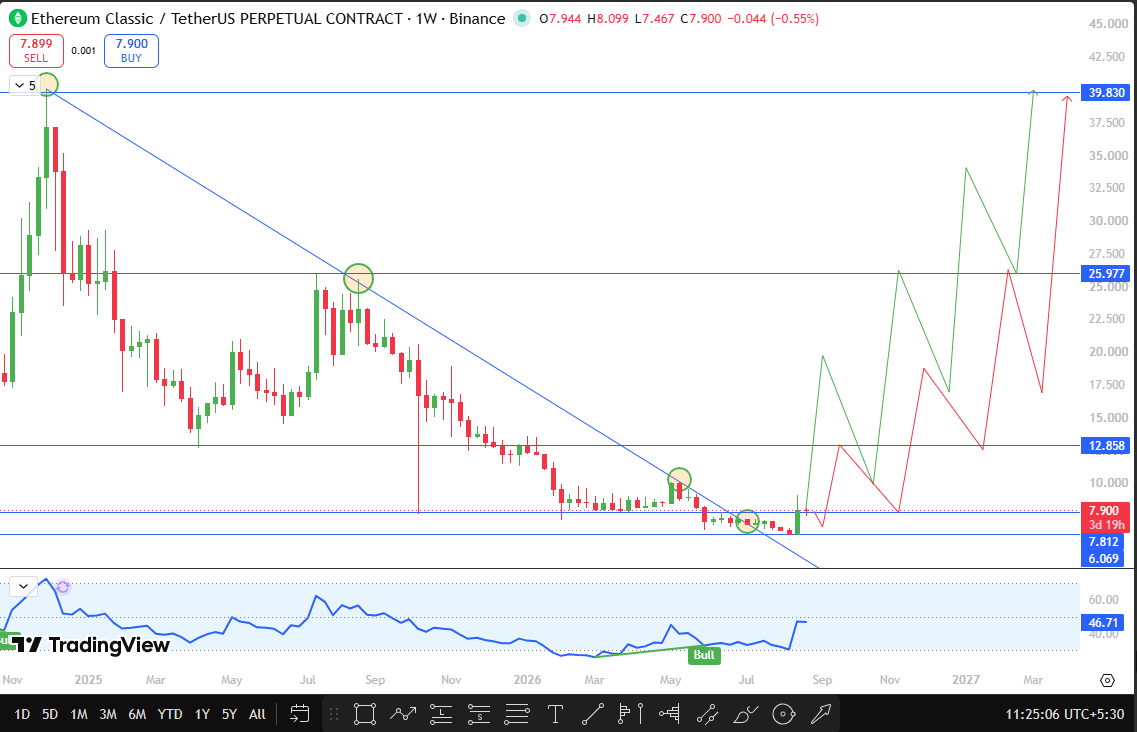
For most of that stretch, every rally attempt ran straight into that falling line and got sold right back down.
What has changed recently is that price has managed to sustain above this trendline rather than just tagging it and reversing, and that shift matters.
A breakout that holds, rather than one that spikes and fades, is usually the kind that reflects a genuine change in the balance between buyers and sellers.
Part of what has made this move possible is the sheer exhaustion on the selling side.
After such an extended decline, the weekly momentum indicator, now reading near 46.71 and showing a bullish tag on the chart, suggests selling pressure has thinned out considerably even as broader crypto market sentiment has turned more constructive.
That combination, weak sellers meeting improving risk appetite, is often what allows a longer-term downtrend to finally break rather than just pause.
If ETC can close a weekly candle above $12.858, that confirms the breakout is genuine and not just a temporary push through the trendline. From there, this Ethereum Classic technical analysis in September 2026 views $25.977 as the next major resistance, an old swing high that once acted as a lower high on the way down and would now flip into a key upside target.
Beyond that, $39.830 stands out as the major resistance, marking the original swing high the entire descending trendline was drawn from, and reclaiming it would represent a full structural reversal of the multi-year downtrend.
On the downside, this bullish structure stays intact as long as ETC holds above $6.069.
A weekly close below that level would invalidate the setup entirely, suggesting the recent trendline breakout has failed and the broader downtrend has reasserted itself.
Every one of the support and resistance zones in this ETC price forecast for September 2026 comes directly from old swing highs and lows on the chart, not arbitrary numbers, which is part of why they carry weight as reaction points going forward.
Source: TradingView, ETC/USDT perpetual chart, 1-week timeframe, Binance, captured August 27, 2026, IST.
ETC Support and Resistance Levels to Watch
Level Type | Price | Change from CMP | Note |
Support | $6.069 | -23.18% | Old swing low; weekly close below this invalidates the bullish setup |
Support | $7.812 | -1.11% | Recent swing low, immediate structure to hold |
Resistance | $12.858 | +62.76% | Old swing high; weekly close above this confirms breakout. |
Resistance | $25.977 | +228.82% | Prior to the lower high on the descending trendline, now a major upside target |
Resistance | $39.830 | +404.18% | Original swing high; the downtrend began from |
Ethereum Classic Price Prediction: Bull, Base, and Bear Cases
The base case has ETC consolidating above the descending trendline through much of September, building a base without yet confirming a decisive close through $12.858.
The bull case activates on a weekly close above $12.858, which opens a path first to $25.977 and eventually the major resistance at $39.830.
This ETC breakout prediction September 2026 is supported by the trendline already in place, thinning sell-side pressure after an extended decline, and a broader crypto sentiment backdrop that has turned more favorable for smaller proof-of-work coins like ETC.
The bear case needs a weekly close below $6.069, which would mean the recent trendline breakout has failed to hold, putting ETC back into its longer-term downtrend and opening room toward deeper old lows.
On-Chain and Fundamental Drivers
Ethereum Classic remains one of the more recognizable proof-of-work networks still in operation, a distinction that has grown more relevant as the broader market periodically revisits interest in mining-based chains as a hedge against proof-of-stake concentration risk.
ETC also carries a long historical association with Ethereum, given its shared origin as the original unforked chain following the Ethereum network's early split, and price action across ETC has at times taken cues from broader Ethereum price prediction sentiment even though the two networks have since diverged significantly in design and roadmap.
With circulating supply at 157.97 million already close to the 210.70 million max supply cap, ETC has limited future dilution ahead, which can amplify the impact of renewed demand once a breakout is confirmed.
Open interest near $90.20 million against a $1.23 billion market cap also shows leverage is present but not excessive, leaving room for the move to extend without an immediate over-crowding risk on the derivatives side.
September 2026 Catalysts
The most immediate catalyst for ETC is whether it can convert this trendline sustain into a confirmed weekly close above $12.858 in the coming weeks.
Beyond the chart itself, broader crypto market sentiment, Bitcoin dominance trends, and any renewed attention toward proof-of-work assets relative to the Ethereum ecosystem's own price prediction narrative could all meaningfully influence this Ethereum Classic price outlook for September 2026.
Risks to This Ethereum Classic Outlook
The primary risk to this bullish thesis is a failure to hold the recent breakout, since ETC spent over a year under sustained selling pressure before this move, and a fade back below the trendline would suggest the downtrend simply paused rather than ended.
A weekly close below $6.069 would confirm that scenario. Broader risks include a reversal in crypto market sentiment, renewed Bitcoin dominance strength pulling liquidity away from smaller altcoins, and macro conditions turning less favorable for risk assets generally.
How to Buy and Store Ethereum Classic
ETC can be purchased on major exchanges through spot or futures markets, with Binance among the platforms offering active ETC pairs.
For long-term holding, moving ETC into a hardware or non-custodial wallet remains standard security practice, while active traders may prefer to keep smaller amounts on exchange for liquidity around the key technical levels outlined above.
Glossary
Descending trendline: a downward-sloping line connecting a series of lower highs, acting as dynamic resistance until price sustains above it
Trendline breakout: a move where price closes and holds beyond a trendline that had previously capped upside
Weekly close: the final traded price when a weekly candle finishes, used to confirm whether a breakout or breakdown is genuine
Proof of work: a blockchain consensus mechanism relying on computational mining rather than staked capital
Support: a price zone where buying pressure has previously stepped in
Resistance: a price zone where selling pressure has previously capped upside
Invalidation level: the price point at which a forecast scenario is considered incorrect
Disclaimer
This article is for informational purposes only and does not constitute financial advice. Cryptocurrency markets are highly volatile, and all price levels discussed are based on technical chart analysis, not a guarantee of future performance. Readers should conduct their own research before making any investment decisions.

















