Falcon Finance Price Prediction: Explodes 30%, What’s Fueling Rally?


Falcon Finance just went vertical, and nobody has a clean explanation why. $FF spiked higher on volume that beats its usual daily turnover, catching traders off guard and pulling fresh eyes back to a token that spent most of 2026 grinding lower.
This Falcon Finance Price Prediction looks at what's actually behind the move and whether FF has room left to keep climbing.
Market data was checked on September 2, 2026, at 4:39 PM IST.
Why Is $FF Price Up Today?
There's no single confirmed news event behind today's move. Trading volume spiked sharply, pointing to speculative buying rather than one specific announcement.
Falcon Finance has also been in the news for its institutional fUSD stablecoin push with Anchorage Digital, part of the broader narrative around the token this year. CoinGabbar could not independently verify a direct cause for today's spike.
Falcon Finance Price Prediction: Market Overview
| Metric | Value |
| Price | $0.11149 |
| 24h Change | +30% |
| Market Cap | $329.03M |
| Unlocked Market Cap | $337.01M |
| FDV | $1.07B |
| 24h Volume | $87.7M |
| Vol/Mkt Cap (24h) | 26.73% |
| Liq/Mkt Cap | 1.27% |
| Total Supply | 10B FF |
| Max Supply | 10B FF |
| Circulating Supply | 3.06B FF |
| Holders | 38.81K |
Source: Data from CoinMarketCap as of September 2, 2026, at 4:39 PM IST. Figures may vary slightly across other tracking websites.
$FF Liquidation and Volume Snapshot
Liquidations (Coinglass, Futures)
| Timeframe | Total Liquidations | Long | Short |
| 1H | $7.47K | $486.08 | $6.99K |
| 4H | $75.30K | $24.55K | $50.76K |
| 12H | $90.40K | $28.03K | $62.36K |
| 24H | $169.41K | $63.16K | $106.25K |
Shorts took the bigger hit across every window, consistent with a move that caught bears off guard.
Source: Data From CoinGlass
Exchange Volume Breakdown (Coinglass, Futures)
| Exchange | 24h Futures Volume |
| Binance | $78.79M |
| Bybit | $21.07M |
Combined futures volume tops $153M across these exchanges, led by Binance.
FF Price Prediction Chart: Technical Analysis
Pair: FF/USD · Market: Spot (Crypto, aggregated) · Timeframe: 1D · Source: TradingView · Timestamp: September 2, 2026, 16:52 UTC+5:30
FF trades at $0.11149, after breaking above a descending trendline that had capped the price since late 2025.
That imp breakout turned the old resistance zone near $0.09638 into first confirmed support, with a deeper support at $0.08431, while price now pushes right up against the $0.11952 resistance zone above.
The chart's own measured-move projection points to $0.20234, an 80% move from the breakout zone, as an upside target if momentum carries through.
The EMA 20 at $0.08570 and EMA 50 at $0.07635 sit close to that deeper support zone, adding further weight to it.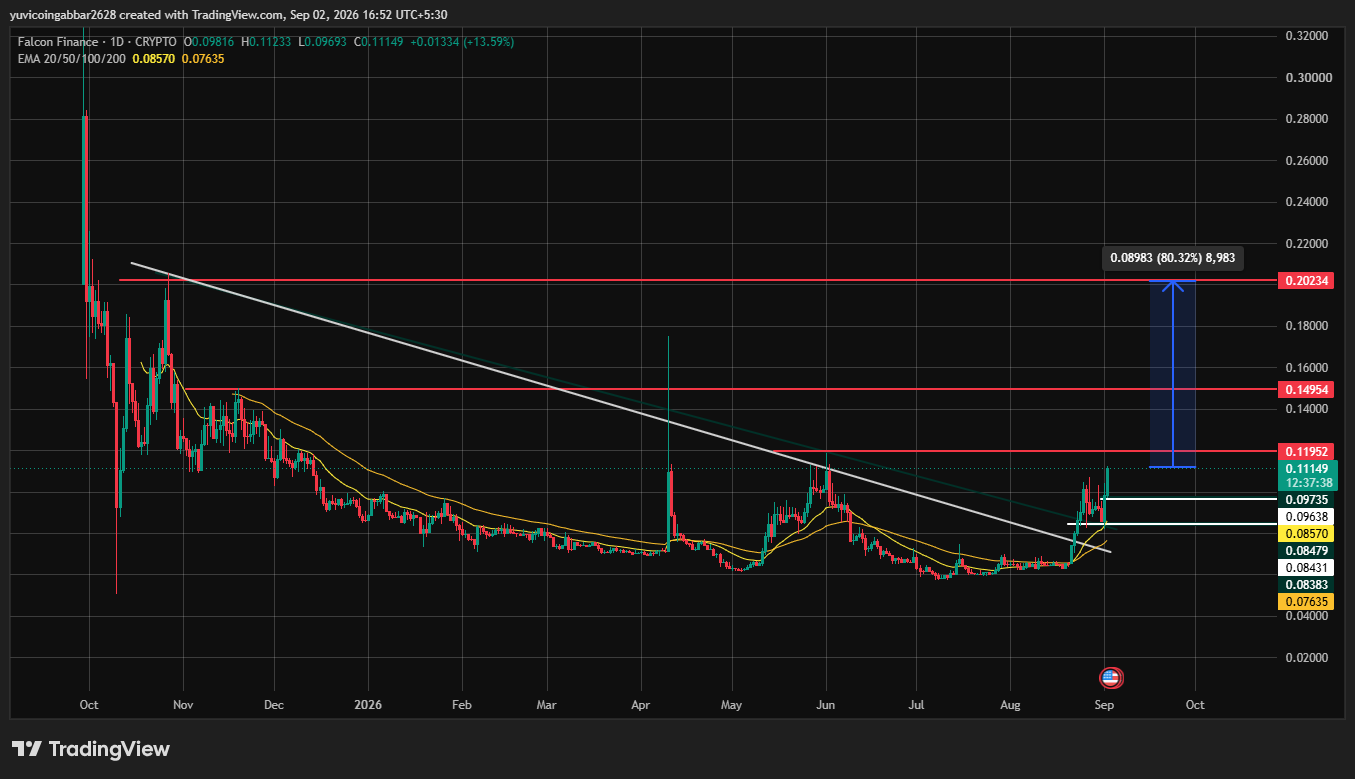
Falcon Finance Price Prediction: Key Levels
| Level Type | Price |
| Resistance 3 | $0.20234 |
| Resistance 2 | $0.14954 |
| Resistance 1 (nearest) | $0.11952 |
| Immediate Price Reference | $0.11149 |
| First Confirmed Support | $0.09638 |
| Deeper Support | $0.08431 |
$FF Forecast: Bull Case vs Bear Case
Bull case: Holding above the first confirmed support at $0.09638 keeps the breakout intact.
A confirmed close above $0.11952 would open the path toward $0.14954, with $0.20234 in view if the move extends.
Bear case: A break below $0.09638 would put the breakout in question, exposing the deeper support at $0.08431 and reviving the longer downtrend that has weighed on $FF through most of 2026.
Can Falcon Finance (FF) Reach $0.20234?
$0.20234 is the highest resistance level marked on the $FF chart and matches the chart's own measured-move projection.
Reaching it would require $FF to first clear $0.11952, then $0.14954, a multi-stage move rather than a single leg.
FF Price Prediction 2026: Expert View
According to CoinGabbar analysts , $FF's breakout came on volume that dwarfs its usual turnover, which usually means a fast move followed by consolidation rather than a straight line higher.
$0.09638 is the level that keeps the breakout intact, and $0.11952 is what needs to break for the next leg.
With no confirmed catalyst behind the pump, this move deserves some caution until it's tested on lower volume.
Disclaimer
This article is for informational purposes only and does not count as financial advice. The levels and scenarios discussed above come from technical chart analysis and publicly available data at the time of writing, and crypto prices, especially after a sharp volume-driven move, can shift quickly, so historical patterns do not guarantee what happens next. Readers should do their own research and weigh their own risk tolerance before making any decisions based on the levels covered here.
Also read:
















