Sei Price Prediction: Can This Squeeze Push SEI Toward $0.050?


Sei price prediction interest is building as the token quietly puts together one of the more consistent uptrends on the board right now.
It is not the flashiest move out there, but the structure has been clean; every pullback so far has found buyers before the last one, and that kind of pattern tends to earn a second look from traders scanning for the next setup. Here is the full picture.
SEI Price Today: Live Price and 24-Hour Change
$SEI is changing hands around 0.04633 dollars, up 0.0009084 dollars, or roughly 2% on the day, according to CoinGlass data.
The token carries a market capitalization of 345.06 million dollars against a circulating supply of 7.46 billion SEI out of a total and max supply of 10 billion.
Futures volume over the past 24 hours sits at 87.39 million dollars, spot volume is at 10.80 million dollars, and open interest across derivatives desks stands at 52.36 million dollars, showing a modest but active market backing this SEI price prediction as the uptrend continues.
Source: CoinGlass, September 2, 2026.
SEI Liquidation Data: Longs vs Shorts Today
The liquidation picture here is about as lopsided as it gets, and it tells its own story about how one-sided this move has been.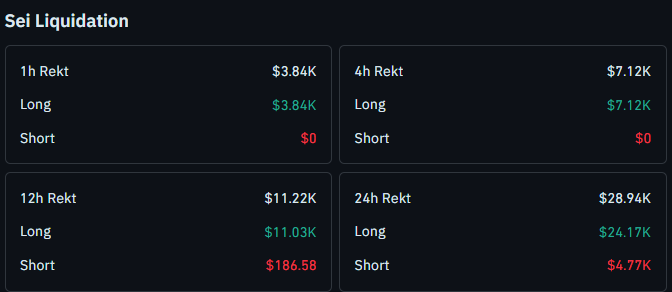
Over the past 24 hours, 28.94 thousand dollars in positions were liquidated, with 24.17 thousand dollars of that coming from longs against just 4.77 thousand dollars from shorts.
Zoom into the last 4 hours, and it gets even more extreme: 7.12 thousand dollars in long liquidations and literally zero dollars in short liquidations. The same pattern shows up in the 1-hour window too.
Shorts have clearly been getting squeezed harder than longs through this climb, which fits with a market that keeps grinding higher rather than reversing sharply.
Source: CoinGlass, September 2, 2026.
SEI Quick Take: Key Levels and Buy Signal Today
CMP: 0.04640 dollars (1-hour chart, Binance perpetual)
1-hour close trigger to watch: above 0.04735
1 hour close failure to watch: below 0.04442
Data timestamp: September 2, 2026
Risk note: a steady grind higher can reverse quickly on a 1-hour chart, so confirm the close rather than reacting to an intrabar spike
SEI Technical Analysis and Price Forecast
On the 1-hour Binance chart, SEI has been climbing along an ascending trendline, where every single retest so far has managed to print a higher high than the one before it, a sign that buyers keep stepping in earlier and with more conviction each time the price pulls back.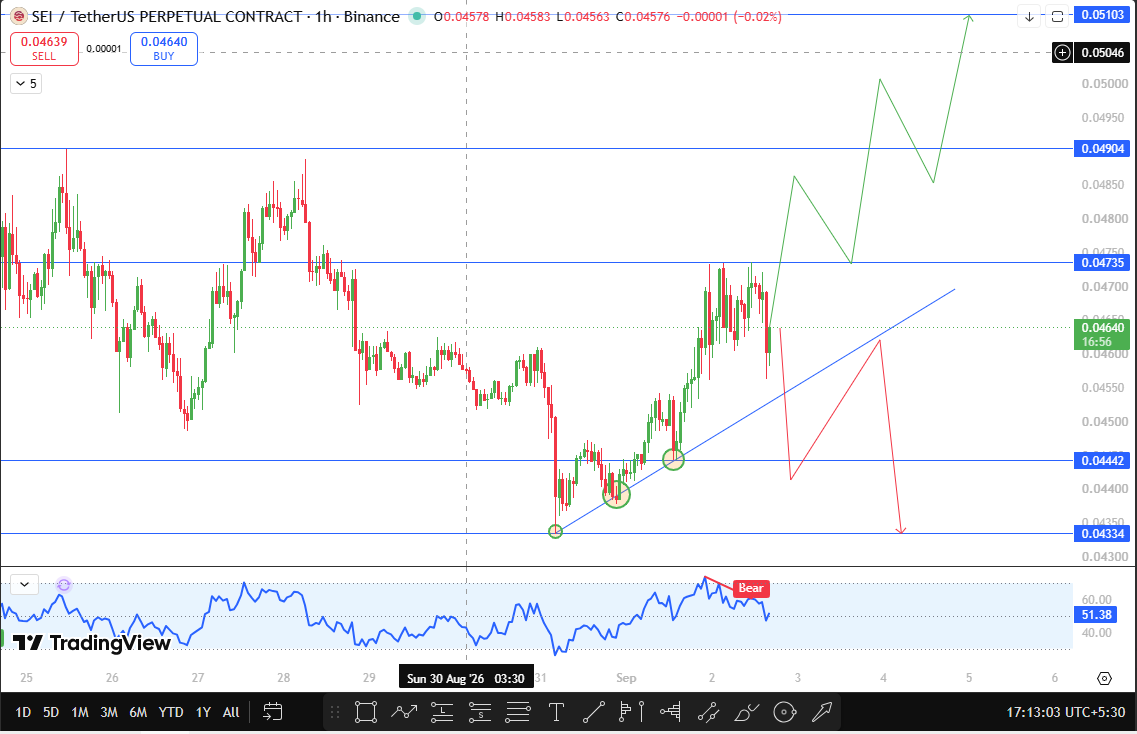
That kind of repeated strength is exactly what makes this SEI price target worth watching closely as it approaches the next level overhead.
If the price takes a retest from the trendline and then manages a close above 0.04735, the next resistance to watch becomes 0.04904.
Beyond that, 0.05103 stands out as the next target for this SEI breakout prediction if the trendline keeps doing its job.
On the downside, a close below 0.04442 would put the next support at 0.04334, which would be the first real sign that this run of higher highs has finally lost momentum.
Chart source: TradingView, SEI/USDT Perpetual, Binance, 1 hour, September 2, 2026.
SEI Support and Resistance Levels Today
Level Type | Price | Change from CMP (0.04640) |
Resistance 2 | 0.05103 | +9.98% |
Resistance 1 | 0.04904 | +5.69% |
Breakout Trigger | 0.04735 | +2.05% |
CMP | 0.04640 | — |
Support 1 | 0.04442 | -4.27% |
Support 2 | 0.04334 | -6.59% |
Sei Price Prediction Scenarios: Bull, Base, and Bear Cases
Given how clean this uptrend has looked so far, the bull case here is fairly straightforward.
A trendline retest followed by a close above 0.04735 keeps the streak of higher highs alive, and 0.04904 becomes the next stop fairly quickly, with 0.05103 in range if the same buying pattern that has shown up on every prior dip continues to repeat.
The base case is really just more of what has already been happening; $SEI keeps grinding higher in small steps, pulling back toward the trendline, finding buyers, and pushing on again.
It is not the kind of setup that needs a dramatic catalyst; it just needs the current rhythm to hold for a bit longer.
The bear case only really kicks in if that rhythm finally breaks.
A close below 0.04442 would be the first higher low this trendline has failed to produce, and that shift alone would be reason enough to watch 0.04334 as the next real test, since it would suggest the buyers who have shown up on every dip so far are finally starting to step back.
Risks to Watch in This Sei Price Prediction
The liquidation data leaning so heavily toward shorts getting squeezed is a good sign for the current trend, but it also means a chunk of this move has been fueled by forced buying rather than fresh conviction, and that kind of fuel can run out fast once there is nothing left to squeeze.
On a 1-hour timeframe especially, moves that look clean in hindsight can whip-saw hard in real time, so treat every close near 0.04735 or 0.04442 with a bit of caution before assuming it is final.
And as always, $SEI is still an altcoin, so a sudden shift in Bitcoin or broader risk sentiment could disrupt this technical picture regardless of how strong the trendline has looked up to now.
Key Terms to Understand Sei Price Prediction
Ascending Trendline: A rising line connecting a series of higher lows, used to track dynamic support during a steady uptrend.
Higher High: A peak in price that sits above the previous peak, generally read as a sign that an uptrend remains intact.
VWAP: Short for volume-weighted average price, a benchmark that reflects the average price a token has traded at over a period once volume is factored in, often watched as a short-term support or resistance zone.
Short Squeeze: A situation where traders betting on a price drop get forced to buy back their positions as the price rises against them, often adding extra fuel to the move.
Disclaimer
This article is for informational purposes only and is not financial advice. $SEI, like any crypto asset, can reverse direction quickly even during a strong uptrend. Do your own research and speak with a financial advisor before making any decisions based on this analysis.
Also read:
















