GRVT Token Price Prediction: Breakout Ahead, Next Rally or Pullback?


$GRVT is back on trader radars after a sharp intraday squeeze, with short positions taking the brunt of the liquidations while the token holds above its short-term moving average.
Grvt is a self-custodial on-chain platform offering yield-bearing savings alongside spot and perpetual trading across crypto, equities, and commodities, according to the project's own materials.
This GRVT Token Price Prediction looks at the liquidation and volume data, the holder concentration behind the token, and the chart levels that matter next. Stick around; the holder data alone changes how you should read this chart.
GRVT Token Price Prediction Today: Market Overview
Metric | Value |
Price | $0.2779 |
24h Change | +6.05% |
Market Cap | $31.7M (+5.96%) |
Unlocked Market Cap | $31.7M |
24h Volume | ~$155.76M (+9.32%) |
Vol/Mkt Cap (24h) | 468.49% |
FDV | $277.13M |
Liquidity/Mkt Cap | 3.05% |
Total Supply | 1B GRVT |
Max Supply | 1B $GRVT |
Circulating Supply | 114.31M $GRVT |
Holders | 24.98K |
Source: Data from CoinMarketCap as of 3/08/2026. Figures may vary slightly across other tracking websites.
GRVT Token Liquidation and Volume Data
Total liquidations across all traders reached $320.73K over 24 hours, split between $128.39K in long liquidations and $192.34K in short liquidations.
That short-heavy pattern holds across every shorter window too: $109.52K in shorts versus $19.69K in longs over 12 hours and $22.24K in shorts versus $8.83K in longs over 4 hours. 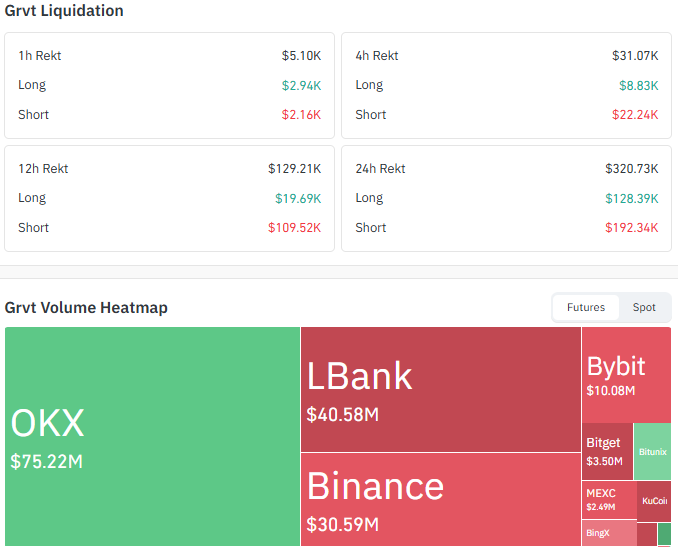
Source: Data From CoinGlass
This is a real, exchange-reported liquidation pattern rather than a price driver on its own, but it reads as a short squeeze, with traders betting against $GRVT getting forced out as the price pushed higher, which can add fuel to a move without reflecting fresh buying demand.
On the volume side, futures trading is concentrated on a handful of exchanges. OKX leads with $75.22M in futures volume, followed by LBank at $40.58M and Binance at $30.59M, with Bybit ($10.08M), Bitget ($3.50M), and MEXC ($2.49M) trailing behind.
Combined futures volume across these venues runs well above $GRVT's $31.7M market cap, a reminder that much of today's price action is being driven by leveraged derivatives trading rather than spot demand alone.
GRVT Token Whale Concentration: What the Holder Data Shows
Just 23 wallets classified as "whales," making up only 1.91% of all holders, control 99.87% of total supply. 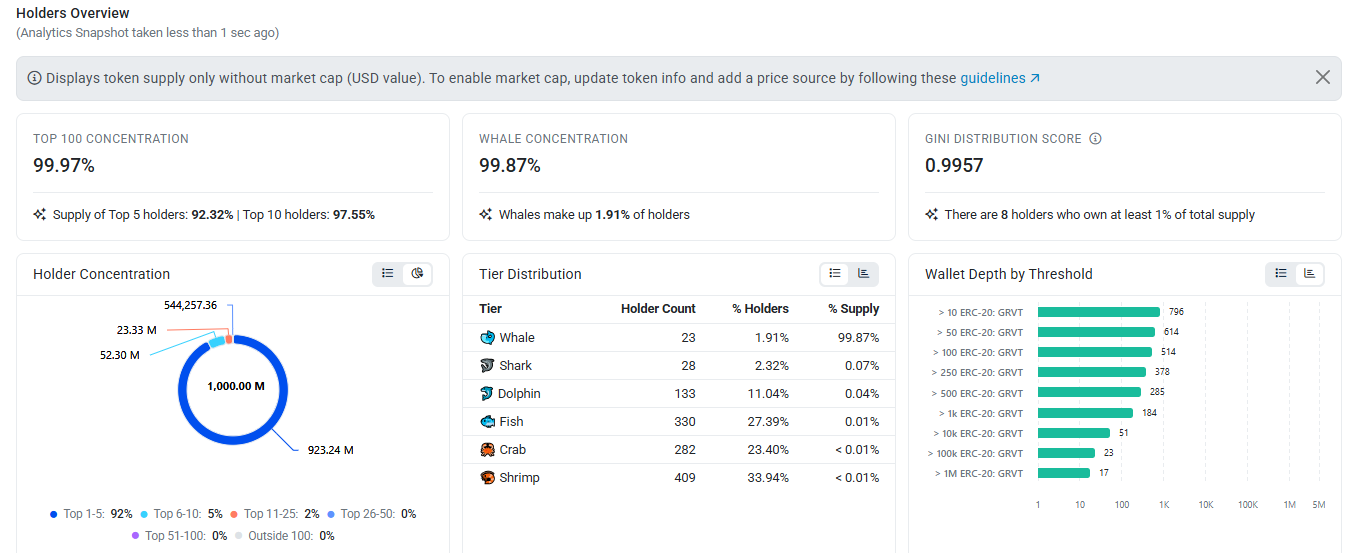
The top 5 wallets alone hold 92.32% of the supply; the top 10 hold 97.55%; and the Gini Distribution Score sits at 0.9957, close to the maximum possible inequality reading.
This is a real, on-chain-reported structure rather than a price driver on its own, but it's a meaningful piece of context: GRVT's price is currently being set by a very small number of large holders, typical of a token still early in its post-launch unlock schedule.
GRVT Token Prediction Chart: Technical Analysis
Pair: $GRVT/USDT · Market: Spot · Exchange: KuCoin · Timeframe: 1H · Source: TradingView · Timestamp: August 3, 2026, 14:11 UTC+5:30
The 1H chart shows $GRVT trading at $0.2779, down after pulling back from a recent swing high near $0.3027.
That level has acted as resistance on this timeframe, capping the last upward push before the current pullback.
Price is still holding above the EMA 9 ($0.2737), a short-term moving average that weights recent candles more heavily, suggesting the pullback hasn't broken short-term momentum yet.
RSI (14) reads a neutral-to-bullish 58.00, not stretched in either direction. Further down, the chart marks a deeper support zone at $0.2324 and a much lower reference at $0.0988 tied to GRVT's earlier, far more volatile trading range following its recent listing.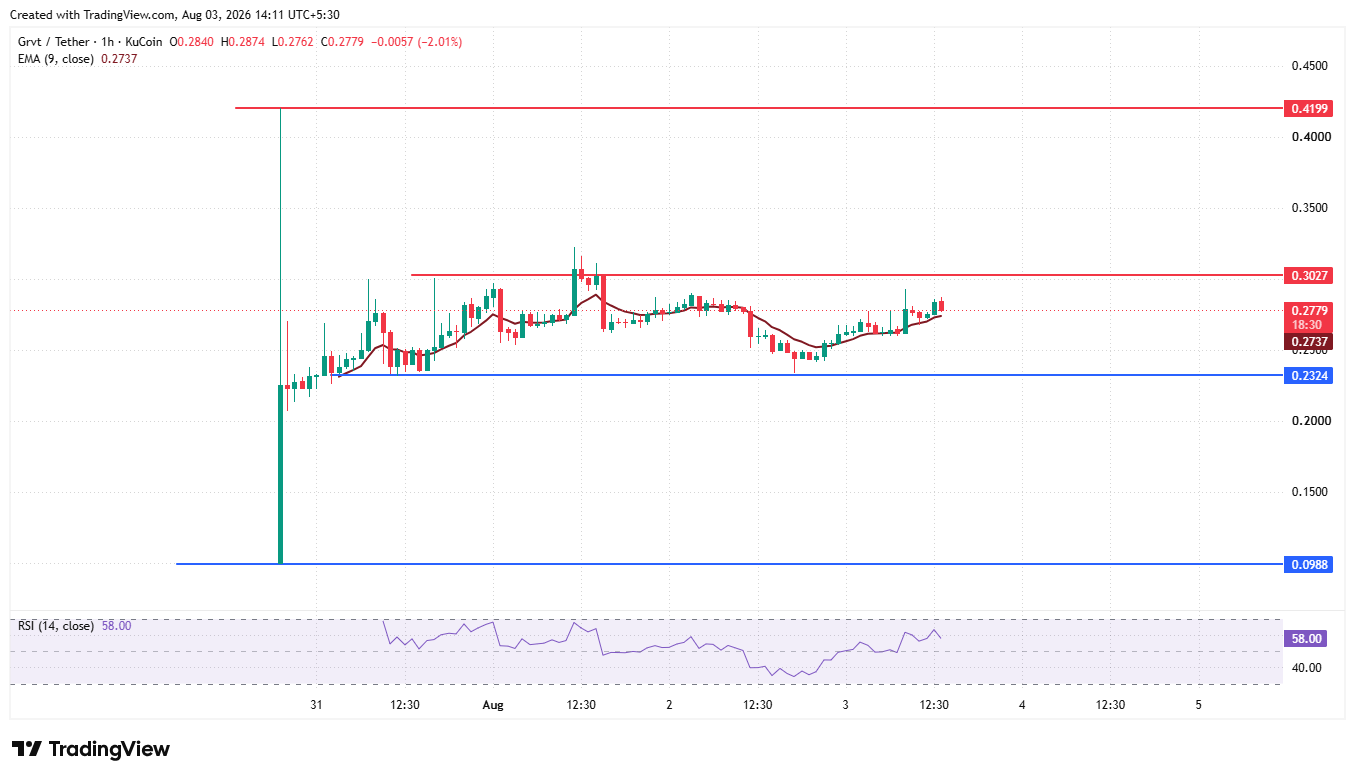
Level Type (1H) | Price |
Resistance 2 (chart high reference) | $0.4199 |
Resistance 1 | $0.3027 |
Immediate Price Reference | $0.2779 |
EMA 9 | $0.2737 |
First Support | $0.2324 |
Deeper Support (early trading range low) | $0.0988 |
GRVT Token Forecast: Bull Case vs. Bear Case
GRVT token price target Bull case: Holding above the EMA 9 at $0.2737 keeps the path toward retesting $0.3027 open.
A confirmed break and hold above that level would put the $0.4199 chart reference in view, though that would need a clear shift toward spot volume rather than just short covering.
GRVT token price target Bear case: A rejection at $0.3027 followed by a loss of the EMA 9 would put the short-term structure in question.
More importantly, losing the $0.2324 support zone would open a path back toward the $0.0988 reference from GRVT's earlier trading range.
Can GRVT Token Reclaim $0.4199?
A move back to the $0.4199 chart reference would be a stretch beyond the near-term picture.
It would require GRVT to first reclaim and hold $0.3027 on genuine spot demand, not just the short-covering seen in today's liquidation data, a multi-stage move where each level needs to break in sequence.
What Could Invalidate the Bullish Setup?
A rejection at $0.3027, followed by a loss of the EMA 9 at $0.2737, would put the short-term bounce in question.
More significantly, a confirmed break below the $0.2324 support zone would open the $0.0988 reference as the next level down, especially given how easily a handful of whale wallets could move the price at this liquidity level.
GRVT Token Price Prediction Methodology
This forecast draws on multiple inputs rather than a single chart pattern: the 1H price structure, EMA and RSI positioning, the liquidation data split between longs and shorts, exchange-level futures volume, and holder concentration data.
No single input is treated as decisive on its own, and the whale concentration data is treated as structural risk context rather than a price driver.
GRVT Token Price Prediction 2026: Expert View
According to CoinGabbar analysts, GRVT's chart is holding up on the surface, with the price above its short-term moving average and the RSI in neutral-bullish territory, but the underlying drivers look thinner than the headline 6% daily gain suggests.
Short liquidations outweighing long liquidations at every timeframe point to a squeeze-assisted move, and with just 23 wallets controlling nearly all of the supply, the float that actually determines price discovery is small.
The real test is whether $0.3027 gets reclaimed on rising spot volume rather than just derivatives churn.
GRVT Token Price Prediction: Data Sources
Market overview data (price, market cap, volume, FDV, and supply) are referenced from a CoinMarketCap snapshot taken on August 3, 2026.
Liquidation and futures volume data are referenced from a crypto liquidation and volume tracker, same date. Holder concentration and wallet tier data are referenced from an on-chain holder analytics dashboard.
Chart price, EMA, and RSI data are referenced from a GRVT/USDT 1H chart on KuCoin via TradingView, timestamped August 3, 2026, 14:11 UTC+5:30. Project description referenced from GRVT's own materials.
Disclaimer: This piece is for informational purposes only and isn't financial advice. Crypto prices are volatile, and it's worth doing independent research before acting on any of the levels discussed here.
1 month ago
I have had my own share of binary option scam, I lost over 22k USD, and i was still told to send more money to unlock my account. I reached out to recoverydarek@gmail.com and they helped me get my money back. If you have ever been scammed or you know someone that has been scammed, recoverydarek@gmail.com will get the money back. They are a recovery team that specialize in ful nds recovery, be it cryptocurrency , bitcoin, forex, catfish/romance scam. They are very real.



















