Helium Price Prediction Today: Can It Reach $0.38 After Breakout?


Helium's native token just did something it hasn't done in months, and traders noticed fast. A three-month slide flipped into a sharp reversal overnight.
Wallets that had gone quiet are active again. Something shifted, and it wasn't just chart luck.
There's a real story here too, involving cell towers and a booming Texas suburb. So what flipped the switch?
Why Everyone Is Suddenly Watching Helium Again
Helium price prediction chatter is spiking across trading desks, and it's not hard to see why. Helium just broke out of a pattern that had trapped it for months.
Turns out, the move wasn't random. A wireless coverage story out of Texas gave the network fresh attention fast.
We pulled up the chart expecting a small bounce. Instead, a full structural shift, RSI included.
But is this the start of something bigger or a fast fade?
Current $HNT Price and Market Snapshot
As of roughly 18:30 UTC on August 29, 2026, HNT trades near $0.28, up close to 29% today, per CoinMarketCap data.
Market cap sits near $52.44M. Volume jumped over 191% in a day, to $9.62M.
The circulating supply is 186.32M HNT against a max supply near 223M HNT. Holders: 536.44K, climbing.
Its all-time high remains $55.22, from 2021. The all-time low, $0.1672, was set fifteen days ago.
Why Is the $HNT Price Moving Today?
This pump has a real catalyst, not just chart momentum.
Helium posted about Celina, Texas, a suburb that grew twenty-five percent in a year. Cell towers couldn't keep pace.
Celina turned its city-wide Wi-Fi into carrier coverage on the Helium Network, giving residents 100GB daily, no new towers necessary.
That's tangible adoption, and this week's crypto news shows sentiment turning bullish, fueling this Helium price prediction.
$HNT Daily Chart Analysis
On the daily chart, HNT broke out of a descending channel capping prices since June.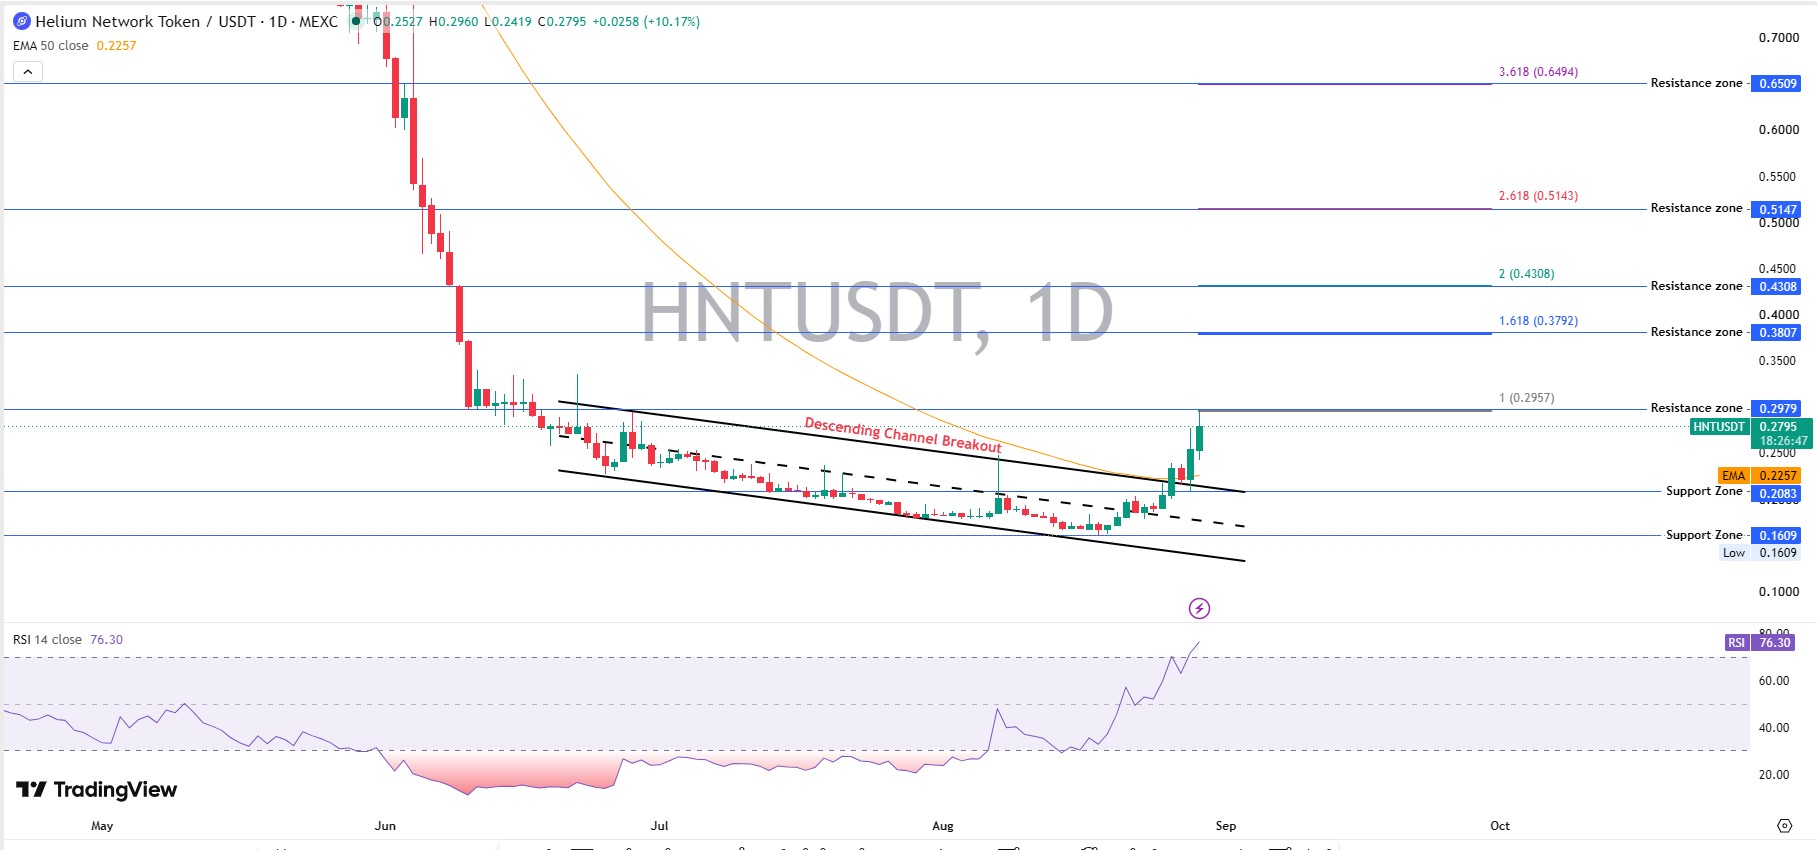
Volume expanded sharply on the breakout candle. The EMA 50, near $0.2257, now acts as support.
RSI 14 reads 76.30, deep into overbought territory. That doesn't guarantee a reversal, but it raises the odds of a cooldown.
Immediate resistance sits at $0.2957, the first Fibonacci extension in this $HNT technical analysis setup. Above that, extensions line up near $0.3792 and $0.4308.
Support holds near $0.2083, with a deeper zone at $0.1609. This chart backdrop still favors bulls, as long as those zones hold.
Whale Positioning: What the Solscan Data Shows
On Solscan, the top 10 holders control 26.36% of supply (49.02M HNT), worth $14.01M. That concentration isn't a new distribution from the breakout; it's existing large wallets holding steady.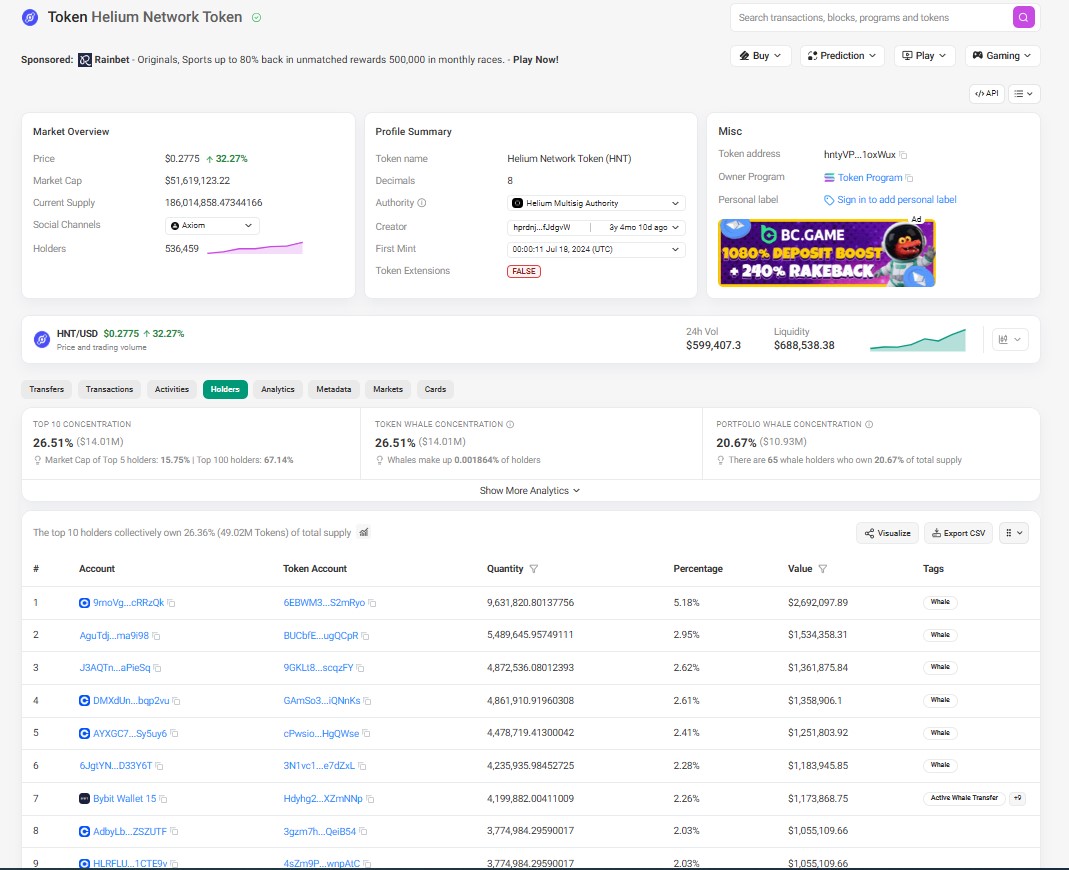
Zooming out, token whale concentration sits at 26.51% ($14.01M), and portfolio whale concentration is 20.67% ($10.93M), spread across 65 whale wallets. In plain terms, a small number of wallets (fewer than 0.002% of all holders) control roughly a fifth to a quarter of circulating supply. That's a normal setup for a mid-cap token, but it does mean any coordinated selling from these wallets could swing price more than retail flow alone.
Liquidation Data: What Coinglass Shows
Liquidation data tells a clearer story about today's move specifically. Over the last 24 hours, $6.36K in positions were liquidated, and the bulk of that, $2.09K, came from short positions versus $4.27K from long ones. Looking at shorter windows, the 1h and 4h liquidation totals ($1.75K each) were entirely short-side, meaning traders betting against $HNT got forced out as the price spiked.
This pattern is a classic short squeeze signature: rather than fresh buyers piling in and accumulating, part of the pump was mechanical, with shorts getting stopped out and adding fuel to the rally. It's worth watching whether the move holds once that squeeze pressure fades.
Where $HNT Is Trading
Volume leads across exchange listings, with Bybit at $2.80M in the last 24 hours, followed by LBank ($1.50M), MEXC ($604.66K), CoinEx ($309.78K), and Gate ($163.78K).
$HNT Price Prediction: Bear, Base, and Bull Scenarios
Timeframe | Bear Case | Base Case | Bull Case | Probability | Invalidation |
7 Days | $0.21 | $0.27 | $0.31 | Bear 25% / Base 50% / Bull 25% | Trading below $0.2083 support |
30 Days | $0.18 | $0.30 | $0.38 | Bear 20% / Base 45% / Bull 35% | Daily trading closes under EMA 50 |
Early 2027 | $0.15 | $0.34 | $0.52 | Bear 20% / Base 40% / Bull 40% | Loss of $0.1609 support zone |
This table isn't a guarantee. It's a probability map, and structure changes.
Is HNT a Good Altcoin to Watch Right Now?
$HNT is an infrastructure altcoin, not a memecoin, and that matters for any HNT price prediction.
Its value ties to real usage, like the Celina coverage deal. That's a fundamentals layer most altcoin price prediction pieces skip.
Unlike presale tokens with unproven tokenomics risk, HNT has a live emissions history under HIP-20, trimming supply toward 223M HNT.
Risks and What Could Invalidate This Setup
Nothing in this Helium price prediction is risk-free. RSI above 76 means momentum could stall fast.
A drop under $0.2083 would undo this breakout's credibility.
Macro risk remains too. Ongoing trade tensions can hit sentiment broadly.
Final Take on Helium Price Prediction
This $HNT price prediction leans cautiously bullish, not blindly bullish.
The breakout is real. But RSI is stretched, and stretched charts don't run straight forever. Watch $0.2957 first.
Disclaimer
This article is for informational purposes only and does not constitute financial, investment, or trading advice. Cryptocurrency markets, including HNT, are highly volatile, and prices can move sharply in either direction. Always do your own research and consult a licensed financial advisor before making any investment decisions.
Also read:

















