Internet Computer Price Prediction: $ICP Rounding Bottom, $2.80 Next?


ICP is waking up, and the chart is flashing a setup traders like to chase.
This Internet Computer price prediction lands right as the price pushes into the top of a months-long rounding bottom pattern, with the focus keyword search interest climbing alongside a sharp move in volume.
Over the next one to two weeks, the bullish case builds if ICP clears and holds above $2.3953, while a slip back under $2.2814 would put the breakout attempt on hold.
With transaction milestones making headlines and liquidations picking up, here's what the chart and derivatives data show.
Market data was checked on August 11, 2026, at 12:12 IST.
Internet Computer Price Prediction Today: Market Overview
Metric | Value |
Price | $2.3558 |
24h Change | +7% |
Market Cap | $1.3B |
FDV | $1.3B |
24h Volume | $85.6M |
Vol/Mkt Cap (24h) | 6.55% |
Total Supply | 555.35M $ICP |
Max Supply | Infinite |
Circulating Supply | 555.35M $ICP |
Source: Data from CoinMarketCap as of August 11, 2026, at 12:12 IST. Figures may vary slightly across other tracking websites.
Internet Computer Liquidation and Volume Data
This section covers futures market data from Coinglass, kept separate from the spot volume figures above.
Liquidations (Long vs. Short)
Timeframe | Total | Long | Short |
1h | $638.62 | $584.11 | $54.51 |
4h | $24.97K | $22.54K | $2.42K |
12h | $77.01K | $44.17K | $32.85K |
24h | $129.23K | $68.84K | $60.40K |
Long liquidations are running ahead of shorts across every timeframe, which fits a market where traders are leaning bullish into the breakout attempt and getting caught on the pullbacks.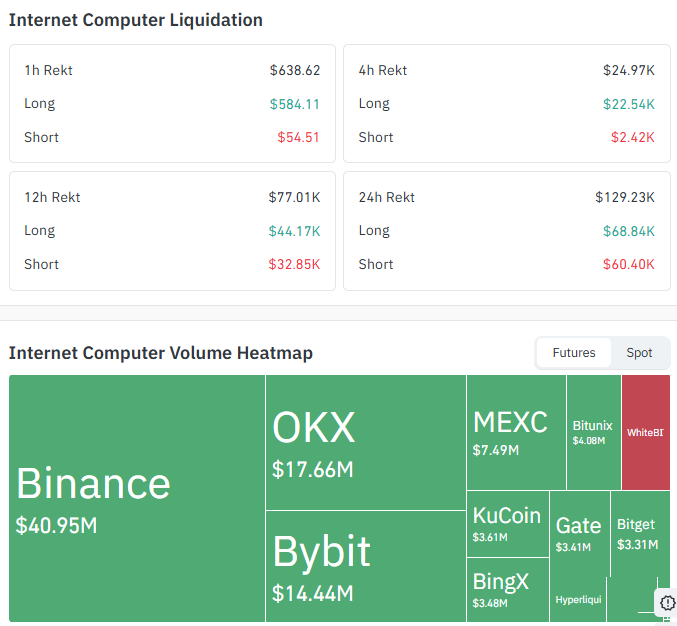
Source: Data From CoinGlass
Futures Volume by Exchange
Exchange | Volume |
Binance | $40.95M |
OKX | $17.66M |
Bybit | $14.44M |
MEXC | $7.49M |
Bitunix | $4.08M |
KuCoin | $3.61M |
BingX | $3.48M |
Gate | $3.41M |
Bitget | $3.31M |
Binance alone accounts for well over half of tracked futures volume, with OKX and Bybit rounding out the next tier.
Internet Computer News: 296 Billion Cumulative Transactions
A post from MSB Intel claims Internet Computer has processed 296 billion cumulative transactions since launch, putting it at roughly 2.5 times Solana's reported 117.6 billion. 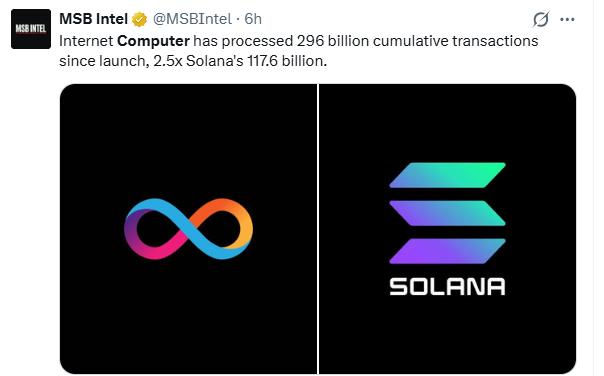
Source: Data From X
Note: CoinGabbar could not independently verify this figure, and since the method, date, and source behind the count aren't documented, it's worth treating this as a third-party estimate rather than a confirmed on-chain metric.
Even so, the claim has added to the attention on ICP as the chart pushes toward a breakout.
Internet Computer Price Prediction Chart: Technical Analysis
Pair: ICP/USD · Market: Spot (Crypto) · Exchange: TradingView Crypto Index · Timeframe: 4H · Source: TradingView · Timestamp: August 11, 2026, 12:12 UTC+5:30
ICP is trading at $2.3558, but the bigger picture is a rounding bottom pattern that has been forming since early July.
Price spent weeks grinding sideways and slowly curling upward before a sharp push higher in the last few days brought it right up against the pattern's neckline near $2.3953.
If the price clears this level and holds above it, that would complete the rounding bottom pattern, and the setup would point toward a continued move higher.
If the price instead breaks back below the current support, the pattern would be at risk of failing, and the recent push higher would look more like a false breakout.
The EMA (Exponential Moving Average, an indicator that tracks the average price over a set number of candles and reacts faster to recent price moves) 20 sits at $2.2228 and the EMA 50 at $2.1623, both well below the current price after the recent rally, showing the short-term trend has already turned upward.
RSI is reading 71.05, in overbought territory, which suggests the move could pause or pull back before any further push higher.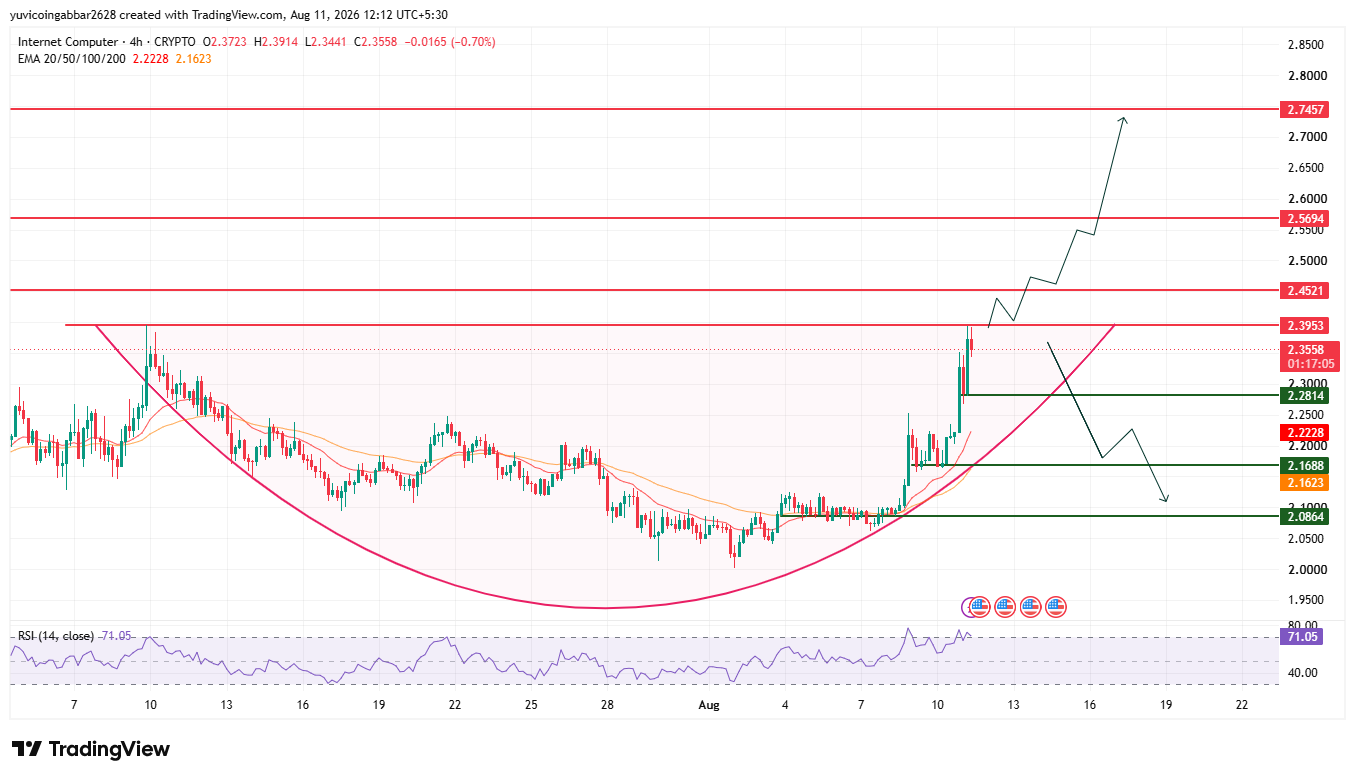
Support and Resistance Levels
Level Type | Price |
Resistance 3 | $2.7457 |
Resistance 2 | $2.5694 |
Resistance (nearest, neckline) | $2.4521 |
Resistance imp | $2.3953 |
Immediate Price Reference | $2.3558 |
First Confirmed Support | $2.2814 |
Deeper Support | $2.1688 |
Structural Floor | $2.0864 |
EMA Levels
EMA | Price |
EMA 20 | $2.2228 |
EMA 50 | $2.1623 |
Internet Computer Forecast: Bull Case vs. Bear Case
ICP price target 2026 Bull case: Holding above $2.2814 and pushing through the neckline zone near $2.3953 to $2.4521 would complete the rounding bottom pattern.
A confirmed break and hold above that zone would open the path toward $2.5694 and then $2.7457.
ICP price target 2026 Bear case: A break below $2.2814 would put the rounding bottom pattern at risk of failing.
Losing $2.1688 would expose the structural floor at $2.0864 and would suggest the recent rally was a temporary spike rather than a genuine trend change.
ICP price target: Can ICP reach $2.7457?
$2.7457 is the highest resistance level marked on the chart.
Getting there would require ICP to first clear the neckline zone around $2.3953 to $2.4521, confirming the rounding bottom pattern, and then push through $2.5694 before testing $2.7457.
RSI already sitting at 71.05 means the move may need to cool off and consolidate before attempting that next leg.
What Could Invalidate the Bullish Setup?
A rejection at the neckline near $2.3953 followed by a close back below $2.2814 would put the rounding bottom pattern in question.
A deeper break through $2.1688 down to the $2.0864 structural floor would undo the recent recovery and suggest the pattern has failed.
Internet Computer Price Prediction 2026: Expert View
According to CoinGabbar analysts, the rounding bottom pattern on the ICP chart has been building for weeks, and the recent push into the neckline zone is the first real test of whether that base can convert into a genuine trend change.
The RSI near 71 shows momentum is strong, but it's also a level where pullbacks tend to show up before a real breakout confirms.
Long liquidations outpacing shorts across every timeframe suggest buyers have been aggressive on this move, which can work both ways if the neckline rejects price.
The $2.2814 to $2.4521 range is the zone to watch: clearing and holding it would confirm the pattern, while losing $2.2814 would put the whole setup back in doubt.
Internet Computer Price Prediction: Data Sources
Price, EMA, and RSI data referenced from a 4H ICP/USD chart via TradingView, timestamped August 11, 2026, 12:12 UTC+5:30.
Market cap, FDV, volume, and supply data referenced from a crypto market tracker (CoinMarketCap/CoinGecko-style source).
Liquidation and futures volume data referenced from Coinglass. Cumulative transaction claim reported via a post from MSB Intel on X.
Disclaimer: This piece is for informational purposes only and isn't financial advice. The levels and scenarios above are based on technical chart analysis and publicly available data at the time of writing, and crypto markets can move sharply within hours, so past patterns don't guarantee future outcomes. It's worth doing independent research and considering your own risk tolerance before acting on any of the levels discussed here.

















