Kaito Price Prediction: $KAITO Tests Rising Trendline After Pullback


KAITO has had a wild run since it started trading, climbing from a low base earlier this year all the way past $1.30 before cooling off hard.
Right now it's sitting around $1.00, down 12.6% after a rough day that saw it swing between $0.9353 and $1.21.
This kaito price prediction really comes down to one simple question: does this level hold as a floor?
If buyers step back in around here, $KAITO has a real shot at working its way back toward those recent highs.
If this level doesn't hold, expect the slide to continue a while longer before things settle down.
Live $KAITO Price Data
KAITO is currently trading around $1.00 right now, down a sharp 12.6% on the day after ranging between $0.9353 and $1.21 over the last 24 hours. 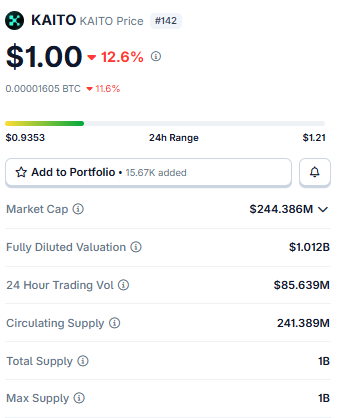
Source: Market Cap Data Taken From Coingecko, data as of Aug 03, 2026. Figures may vary slightly across other tracking websites.
Market cap sits at $244.386M against a fully diluted valuation of $1.012B, with 241.389M tokens circulating out of a fixed 1B total and maximum supply.
Trading volume came in heavy at $85.639M, which lines up with just how volatile today's swing has been.
Against Bitcoin, KAITO fell even harder at 11.6%, so this isn't just dollar weakness bleeding through; it's a KAITO-specific move and one that's brought price right back down to a level it hasn't tested in a while.
Exchange Volume and Liquidation Snapshot
Volume is led by OKX at $133.22M and Binance close behind at $131.90M, with Bybit, BingX, and Bitget rounding out the next tier, plus smaller flows through Hyperliquid, MEXC, and Bitunix. 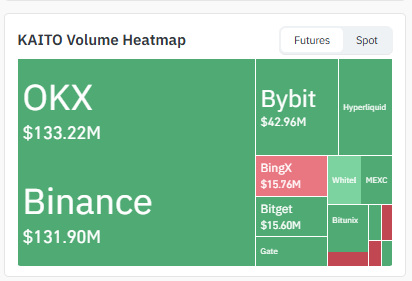
Source: Volume Heatmap Data Taken From Coinglass.
That's a fairly even split between the top two venues, which usually means price discovery isn't overly dependent on any single exchange.
Liquidations tell a rougher story, though. 24-hour liquidations hit $1.43M, with longs bearing the bigger share at $944.86K against $485.36K in shorts. 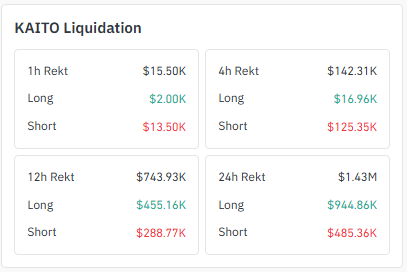
Source: Liquidation Data Taken From Coinglass.
The 4-hour window flips that pattern, with $125.35K in short liquidations against just $16.96K in longs, suggesting today's drop caught late shorts off guard even during the broader long-side flush.
$KAITO News Today
On-chain activity has flagged something worth watching here.
A pair of freshly created wallets recently opened large leveraged long positions on $KAITO through a derivatives platform, putting roughly $7.1M in combined volume behind the trade and becoming two of the biggest long bets on the token anywhere. 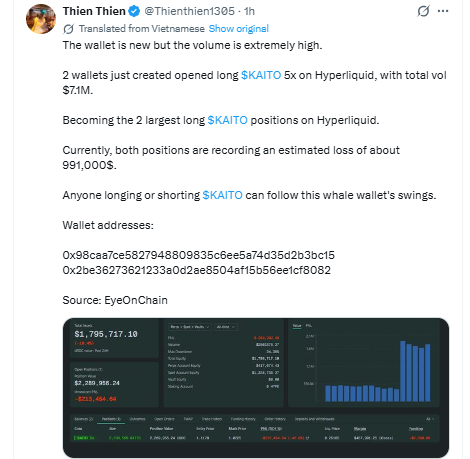
Source: Data Taken From X Account.
Both positions are currently sitting on a paper loss near $991,000 given today's drop, yet neither has been closed out, which some traders are reading as a sign of conviction that this pullback is temporary rather than a trend change.
Whether that bet pays off likely comes down to whether the trendline this article has been tracking actually holds.
Key Takeaways
-
KAITO is down 12.6% on the day, sitting near $1.00 after swinging as high as $1.21 and as low as $0.9353.
-
On the daily chart, the price is right back at its rising trendline. Bounce here with volume, and $1.3789 opens up, with $1.6749 the bigger target after that.
-
Break the trendline instead, and KAITO risks a slide toward $0.6497, with $0.4300 as a deeper level below that.
-
The 4H chart shows a descending channel. Clear the upper boundary, and $1.3435 comes into view, then $1.4810.
-
Break the channel's lower boundary instead, and $0.8110 is the first stop, with $0.7104 right behind it
4H Chart Technical Analysis
Zooming into the 4H chart , $KAITO has been sliding inside a descending channel, currently sitting around $0.9966 after a rejection from the upper edge of the channel.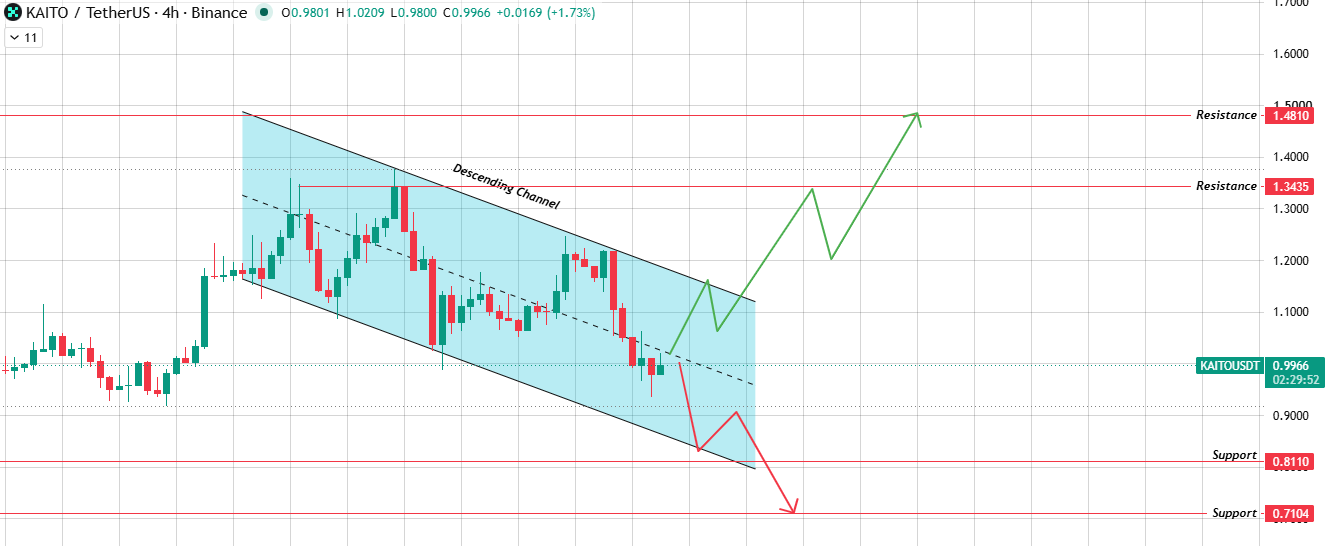
Source: Chart Taken From TradingView.
If the price breaks above the channel's upper boundary with strong volume, $1.3435 is the first level to watch, with $1.4810 possible after that.
Break down through the lower boundary instead; $0.8110 would come first, followed by $0.7104, if selling pressure keeps up.
This shorter-term channel is really just a smaller mirror of the bigger fight happening on the daily chart right now.
Daily Chart Technical Analysis
On the daily chart, KAITO has been respecting a rising trendline all the way up from its recent lows, and the price has now pulled all the way back down to test it near $1.00. 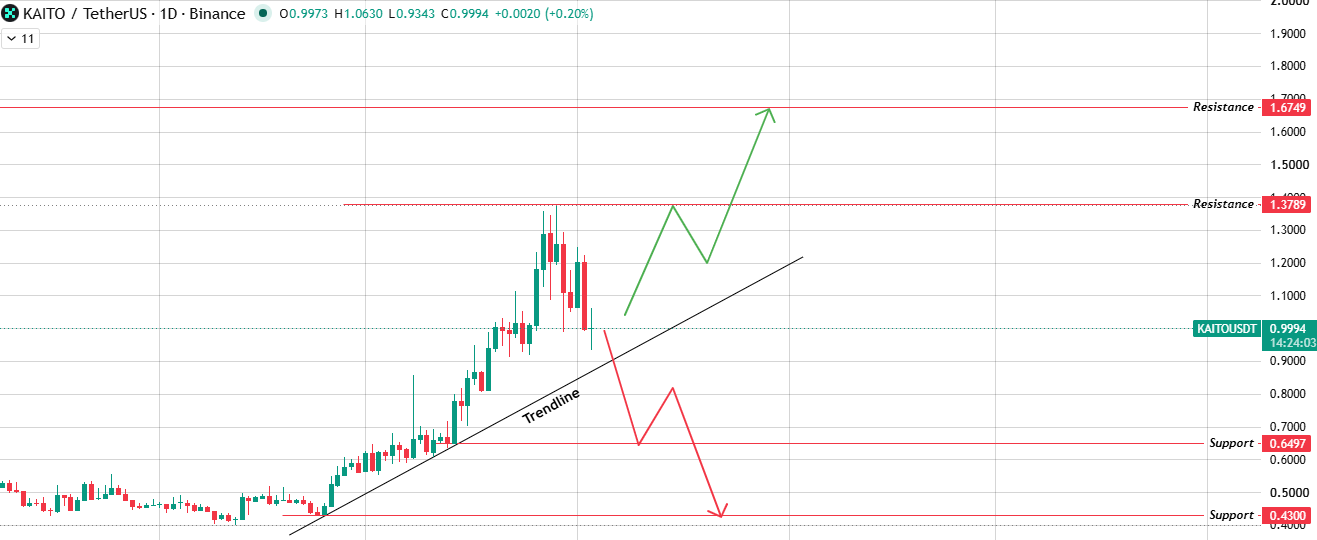
Source: Chart Taken From TradingView.
Here's the setup. Respecting this trendline with volume, the path opens toward $1.3789, with $1.6749 being the bigger level if buyers keep pushing.
But if this trendline breaks instead, if sellers force a close below it, the chart points to $0.6497 as the next stop, with $0.4300 as a deeper level should the selloff really extend.
This trendline test is really the whole ballgame for $KAITO right now.
Bull vs Bear Scenarios
What do bulls need? A clean bounce off the daily trendline, a break above the 4H channel's upper boundary on volume, and a push toward $1.3435 and $1.4810, extending into $1.3789 and eventually $1.6749 on the daily chart.
Bears want the mirror image. The trendline breaks, the 4H channel's lower boundary gives way, and $KAITO slides toward $0.8110 and $0.7104 on the shorter timeframe, with $0.6497 and $0.4300 the deeper daily targets.
This kaito price prediction keeps both paths open until the price actually confirms a close on one side of that trendline.
Methodology: This one's built on technical analysis of the TradingView 4H and daily charts, current market data, exchange volume, and liquidation data. None of it should be taken as financial advice.
Glossary
Rising Trendline: Connect a string of higher lows and you get this. Traders lean on it to see where an uptrend's floor sits as price climbs.
Descending Channel: Picture two downward-sloping lines running side by side, boxing price in as it drifts lower.
Support Zone: Basically a spot where buyers have shown up before. Worth watching for a repeat.
Resistance Level: The opposite idea, a spot where sellers have stepped in and stalled things out in the past.
Liquidation: A leveraged trade getting force-closed once losses chew through the margin backing it.
Disclaimer: This $KAITO price prediction is based on technical analysis and current market conditions. Cryptocurrency markets are highly volatile, and price movements can change rapidly. This content is for informational purposes only and should not be considered financial or investment advice. Always do your own research before making any investment decisions.


















