Midnight Price Prediction: $NIGHT Major Breakout Zone, Next Big Rally?


Midnight (NIGHT) is a privacy-focused blockchain token that has been consolidating after a sharp early rally.
This Midnight Price Prediction looks at where NIGHT could head over the next one to two weeks as price trades right at a key trendline support, with the bullish case staying intact as long as that trendline holds near $0.018144, while a break below it would open the door to further downside.
Here's what the data shows.
Market data checked on August 8, 2026, at 16:30 IST.
NIGHT Price Prediction Today: Market Overview
Metric | Value |
Price | $0.018810 |
24h Change | -0.90% |
Market Cap | $311.24M |
Unlocked Market Cap | $311.47M |
FDV | $449.78M |
24h Volume | $15.2M |
Vol/Mkt Cap (24h) | 4.87% |
Liquidity/Mkt Cap | 0.48% |
Total Supply | 24B NIGHT |
Max Supply | 24B $NIGHT |
Circulating Supply | 16.6B $NIGHT |
Holders | 13.85K |
Source: Data from CoinMarketCap as of August 8, 2026, at 16:30 IST. Figures may vary slightly across other tracking websites.
NIGHT Token Unlocks
According to data reported directly by the Midnight project, 69.25% of the total NIGHT supply, or 16.61B tokens, has been unlocked so far, while 30.75%, or 7.38B tokens, remains locked. 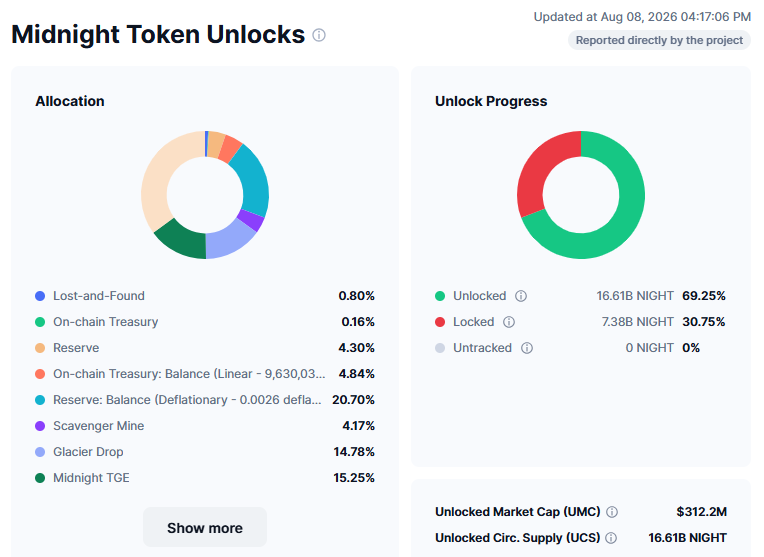
The largest allocations feeding future unlocks include the deflationary Reserve balance at 20.70% of total supply, the Midnight TGE allocation at 15.25%, and the Glacier Drop at 14.78%, with smaller portions tied to the Scavenger Mine, on-chain Treasury balance, and Reserve categories.
With just under a third of supply still to unlock, future token releases remain a factor worth watching alongside the technical picture below.
NIGHT Price Prediction Chart: Technical Analysis
Pair: MIDNIGHT/USDT · Market: Spot (Crypto) · Exchange: CoinEx · Timeframe: 4H · Source: TradingView · Timestamp: August 8, 2026, 16:30 UTC+5:30
$NIGHT is trading at $0.018810 and is currently sitting right at an ascending trendline that has supported price since the July low.
This trendline connects a series of higher lows formed over the past two weeks, and the price is testing it directly at current levels.
RSI (Relative Strength Index, a momentum gauge from 0 to 100) reads 48.36, a neutral reading that doesn't favor either side strongly.
If the price breaks the trendline, it can fall to the lower levels. If it holds at the trendline, it can go up.
The EMA (Exponential Moving Average, a momentum indicator that weights recent candles more heavily) cluster sits just above the current price, with EMA 20 at $0.018902 and EMA 50 at $0.019005, both acting as immediate resistance above the trendline test.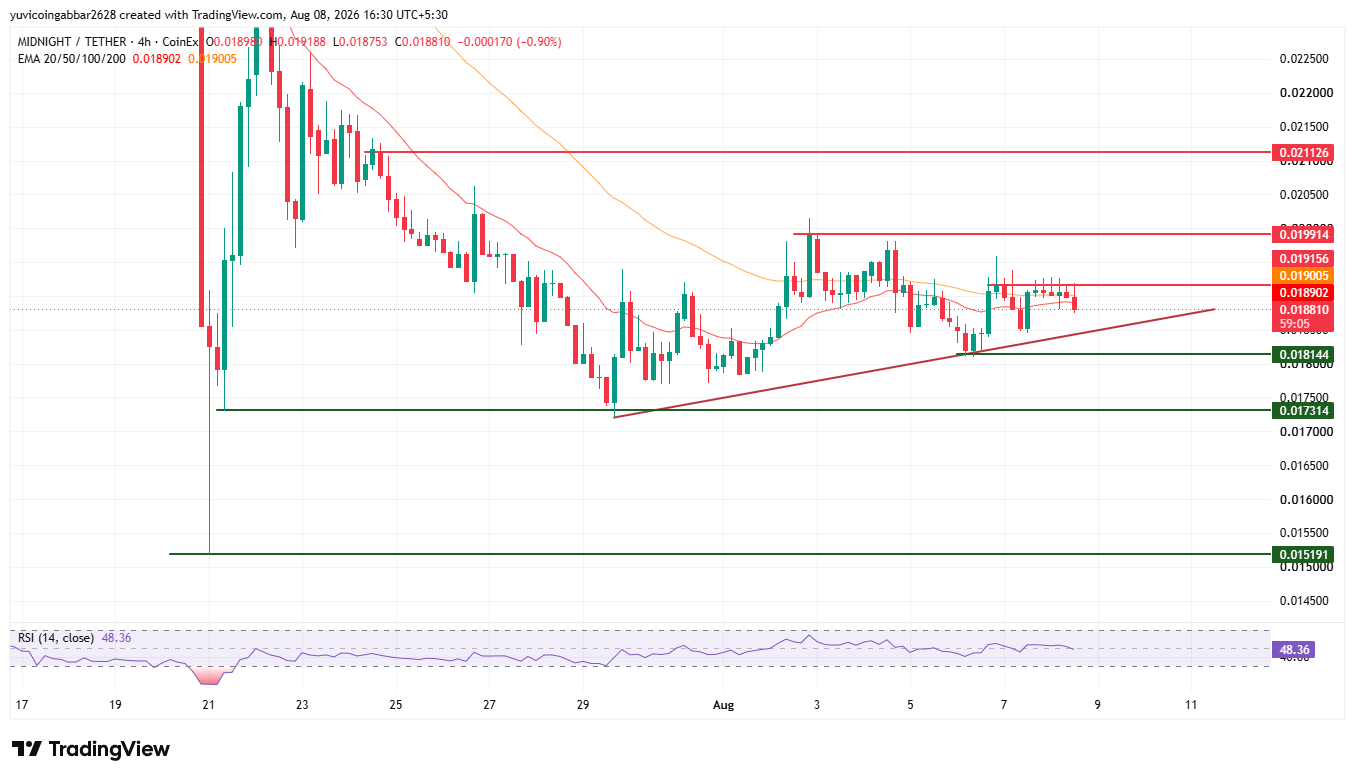
NIGHT future price: Support and Resistance Levels
Level Type | Price |
Resistance 3 | $0.021126 |
Resistance 2 | $0.019914 |
Resistance 1 (nearest) | $0.019156 |
Immediate Price Reference | $0.018810 |
First Support (trendline zone) | $0.018144 |
Deeper Support | $0.017314 |
Structural Floor | $0.015191 |
NIGHT future price: EMA Levels
EMA | Price |
EMA 20 | $0.018902 |
EMA 50 | $0.019005 |
$NIGHT Forecast: Bull Case vs. Bear Case
$NIGHT price target 2026 Bull case: If the price holds the trendline support at $0.018144 and breaks the upper resistance, the upper levels to watch are $0.019156 and $0.019914.
$NIGHT price target 2026 Bear case: If the trendline breaks instead, the price can move toward the lower levels at $0.017314 and $0.015191.
$NIGHT price target: Can $NIGHT Reach $0.021126?
$0.021126 is the highest resistance level marked on the chart. Reaching it would require $NIGHT to first clear the EMA cluster near $0.018902 to $0.019005, then break and hold above both $0.019156 and $0.019914, a multi-stage move rather than a single leg.
What Could Invalidate the Bullish Setup?
A break below the trendline support at $0.018144, followed by a close beneath it, would put the bullish case in question.
A deeper break below $0.017314 would expose the structural floor at $0.015191 as the next downside level.
NIGHT Price Prediction 2026: Expert View
According to CoinGabbar analysts, Price sitting directly on the ascending trendline, with RSI at a neutral 48.36, puts NIGHT at a genuine decision point rather than a clear trend continuation.
The EMA cluster just overhead means even a bounce off the trendline would need to clear resistance quickly to build momentum.
With roughly 30.75% of total supply still locked and set to unlock over time, upcoming token releases add a longer-term supply consideration on top of the immediate trendline test.
The $0.018144 to $0.019156 zone is the key range to watch in the sessions ahead.
NIGHT Price Prediction: Data Sources
Price, EMA, and RSI data referenced from a 4H MIDNIGHT/USDT chart via TradingView on CoinEx, timestamped August 8, 2026, 16:30 UTC+5:30.
Market cap, FDV, volume, and supply data referenced from CoinMarketCap. Token unlock data referenced from CoinMarketCap, reported directly by the Midnight project.
Disclaimer: This piece is for informational purposes only and isn't financial advice. The levels and scenarios above are based on technical chart analysis and publicly available data at the time of writing, and crypto markets can move sharply within hours, so past patterns don't guarantee future outcomes. It's worth doing independent research and considering your own risk tolerance before acting on any of the levels discussed here.
















