MOO Price Prediction 2026-2030: Can This Rally Hold?


MOO just moved fast. The Memory cow Moo (MOO) token jumped hard in 24 hours, and traders want a real MOO price prediction, not a guess.
This token is only about ten days old. That changes how we read the chart.
Trading near $0.0300 as of September 08, 2026 (09:00 UTC), MOO rides a wave of fresh volume on Robinhood Chain. The move is real. But it's young and thin.
MOO Price Prediction Today: Why Is MOO Moving Now?
Current price: $0.02994 to $0.03007, depending on source, at 09:00 UTC on September 08, 2026.
24-hour move: Up 45.5% to 48.2%, a huge single-day swing.
7-day range: $0.01087 to $0.03412, the widest window yet.
Volume: Near $874.9K on GeckoTerminal, higher on some aggregators. Liquidity is scattered.
Market cap: Around $29.1M to $29.7M, since most of the 989.36M supply already circulates.
Recent catalyst: A fresh all-time high of $0.03412, hours old, after bouncing off the all-time low of $0.01087 three days prior.
Liquidity: Just $384.7K in the main pool. Small. Slippage risk is real.
Sentiment: Buyers led sellers, 571 to 622 in 24 hours, and holders climbed past 7,786, per live market data on CoinGecko.
MOO Technical Analysis: Can Bulls Defend the Rally?
We pulled up the 4-hour chart, and the first thing that stood out was how orderly this climb looks against the 20 EMA.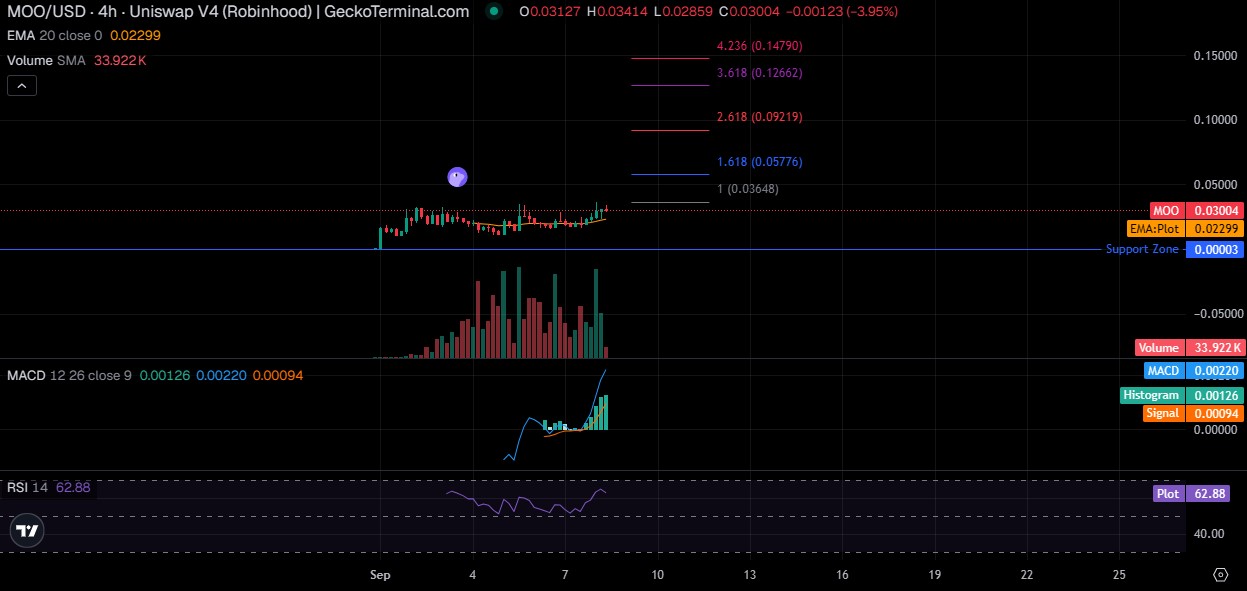
Trading has held above the EMA of $0.02299 through the whole move. The pullback from $0.03414 to $0.03004 looks like profit-taking, not a trend break.
MOO Support Levels to Watch
Immediate support sits near $0.0286, the 24-hour low. Major support is the 20 EMA at $0.02299. Breakout retest support lands near $0.0250.
MOO Resistance and Next Price Targets
First resistance: $0.03648, the Fib 1.0 extension. Major resistance: $0.05776, the Fib 1.618 level. Trading is testing the all-time high of $0.03412 right now. A clean breakout opens the door to $0.09219.
RSI and Momentum Signals for MOO
RSI (14) reads 62.88. Strong, not overheated yet.
MACD sits at 0.00220, above its signal at 0.00094, with a positive histogram of 0.00126. A live bullish crossover, visible in real time on the live MOO price chart.
MOO Price Prediction 2026: Bull, Base and Bear Cases
Scenario | Target | Trigger | Invalidation |
Bull | $0.058 - $0.092 | Breakout above $0.0365 with volume | Rejection back under $0.0365 |
Base | $0.025 - $0.035 | Consolidation above the 20 EMA | Break below $0.0230 |
Bear | $0.012 - $0.018 | Lower high, support fails | Reclaim of $0.0365 |
This is the section most competitors skip the math on. For how other tokens map out similar setups, the crypto price prediction hub is worth a look.
MOO Price Prediction 2027-2030: Long-Term Outlook
Long-term numbers here are scenarios, not guarantees. A ten-day-old token has almost no cycle history.
MOO Price Prediction 2027
Low: $0.015 to $0.020 if volume fades and liquidity stays thin. Base: $0.035 to $0.050 with steady Robinhood Chain adoption. High: $0.075 to $0.110 if deeper liquidity pulls in bigger volume, a trend worth following through AI and crypto news coverage.
MOO Price Prediction 2028
Low: $0.012 to $0.018 in a weak market-cap environment. Base: $0.040 to $0.065, in line with gradual growth. High: $0.090 to $0.140, which needs real market-cap expansion, not short volume spikes.
MOO Price Prediction 2029
Low: $0.010 to $0.015 if meme-coin demand cools. Base: $0.045 to $0.075, holding pace with the wider market. High: $0.100 to $0.160, which leans on bull-cycle assumptions, not arbitrary growth percentages.
MOO Price Prediction 2030
Low: under $0.010 if MOO fades with the cycle. Base: $0.030 to $0.060, a stable mid-range outcome. High: $0.100 to $0.200 on strong ecosystem growth.
MOO Long-Term Price Prediction Summary Table
Year | Low | Base | High |
2026 | $0.012 - $0.018 | $0.025 - $0.035 | $0.058 - $0.092 |
2027 | $0.015 - $0.020 | $0.035 - $0.050 | $0.075 - $0.110 |
2028 | $0.012 - $0.018 | $0.040 - $0.065 | $0.090 - $0.140 |
2029 | $0.010 - $0.015 | $0.045 - $0.075 | $0.100 - $0.160 |
2030 | Under $0.010 | $0.030 - $0.060 | $0.100 - $0.200 |
These ranges widen further out because uncertainty compounds. Treat the far years as scenarios to watch, not targets to bank on.
Can MOO Reach $0.05, $0.10 or $1?
Basically, it comes down to market cap math. Required market cap = target price × circulating supply.
With 989M MOO circulating, $0.05 needs roughly $49.4M, about 1.7x today's cap. $0.10 needs close to $98.9M, over three times current value.
And $1 would need nearly $989M in market cap before supply changes. Not impossible in crypto. Still a massive climb from $29M, and new exchange listing updates could speed that climb up if MOO lands on bigger venues.
MOO Price Prediction Risks Traders Should Watch
Liquidity stays thin, under $400K in the main pool. Volatility already showed its teeth with a 170% swing off the low in three days.
Low historical data means signals here carry less weight than on an older coin. Whale concentration and thin exchange liquidity are real risks too. A sharp post-rally retracement wouldn't shock anyone. Check the latest memecoin market news before sizing a position.
What Could Drive MOO Higher or Lower?
Bullish Catalysts
New exchange liquidity, rising volume beyond $874.9K, and Robinhood Chain growth, trackable through the crypto events calendar, all help. Meme-coin rotation plus Bitcoin strength tends to lift tokens like this together.
Bearish Catalysts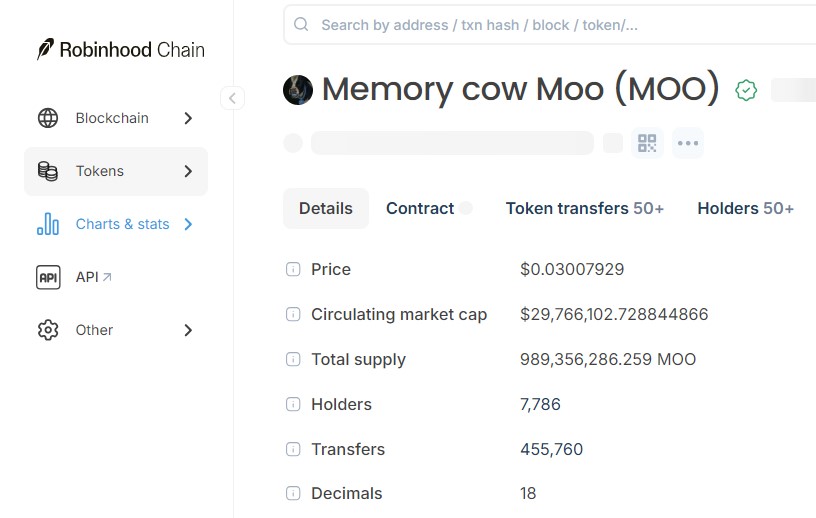
Volume collapse is the first warning sign. Liquidity withdrawal would hit the price fast. Whale selling, a Bitcoin correction, or a failed breakout above $0.0365 could each end this run, and holder shifts are visible on the Robinhood Chain explorer.
MOO Price Prediction: Trader Takeaway
Bullish above $0.0230. Breakout trigger: a close through $0.0365 on rising volume.
First target: $0.0578. Major target: $0.0922. Bearish below $0.0230, invalidated by a break under that level holding past one 4-hour candle.
Is this rally sustainable, or is it early-token hype finding its ceiling? That's worth sitting with.
The setup leans bullish short-term, but it's fragile. Don't treat a ten-day chart like a proven trend. Traders chasing early rewards elsewhere can also scan current crypto airdrop opportunities while they wait for MOO to prove itself.
Disclaimer
This article is for informational purposes only and isn't financial advice. MOO is a newly launched token with limited trading history, low liquidity, and high volatility. All price targets, scenarios, and technical levels are illustrative and not guaranteed outcomes. Always do your own research and consult a licensed financial advisor before making any investment decisions.
Also read:

















