Pepe Price Prediction: PEPE’s Next Move Could Shock Investors


PEPE launched in April 2023, leaning entirely on the internet's favorite frog meme with zero utility promised and zero apologies for it either.
That honesty, weirdly, is part of why it worked. No roadmap to disappoint anyone, just pure meme coin volatility and a community that showed up anyway.
Two years later, PEPE still ranks among the largest meme coins by market cap.
This Pepe price prediction looks at where PEPE stands right now, trading around $0.00000292, and what the current chart setup is hinting at.
Pepe Price Prediction: Live Market Data
PEPE is currently trading at $0.000002903, up 1.8%.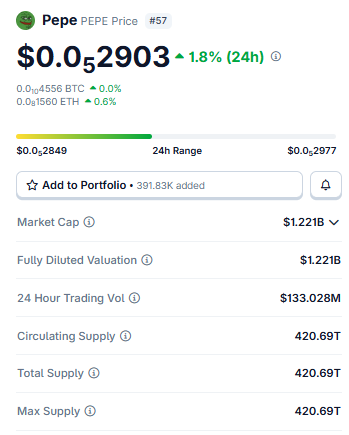 Source: $PEPE Market Cap Data Taken From Coingecko, data as of Aug 04, 2026. Figures may vary slightly across other tracking websites.
Market cap sits at $1.221B, and since PEPE's full supply of 420.69T tokens is already circulating, fully diluted valuation lands at that exact same number.
No hidden unlocks waiting to dilute holders here.
A daily volume of $133.028M keeps this one of the more actively traded meme coins around, giving the price action here more weight than it would carry on a thinner market.
On-Chain and Market Drivers
The liquidation heatmap leans short-squeeze over the last 24 hours, with $87.80K in short positions liquidated against $47.17K in longs.
That gap suggests sellers got caught leaning the wrong way as PEPE climbed through the day. 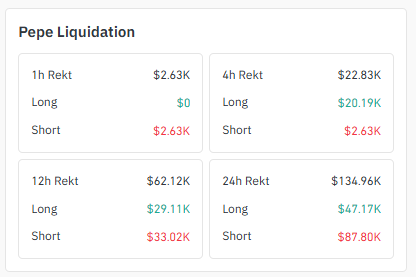
Source: Liquidation Data Taken From Coinglass.
Zoom into the most recent hour, though, and it's almost entirely shorts again, $2.63K liquidated with zero longs touched, which fits a market still grinding upward in the short term.
The 4-hour window flips slightly, with more longs getting hit than shorts, a reminder that even inside an uptrend, pullbacks still catch people off guard.
Exchange volume is dominated by Binance at $12.65M, more than double the next closest venue. OKX follows at $6.49M, then Gate at $4.11M and Bybit at $3.14M. 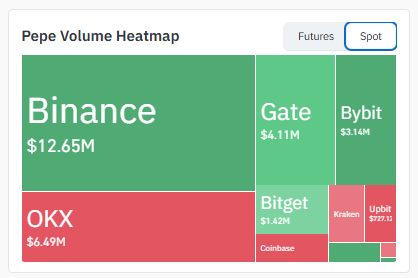
Source: Volume Heatmap Data Taken From Coinglass.
That kind of depth across major exchanges usually means real price discovery rather than one thin order book getting pushed around.
Key Takeaways
-
PEPE is trading at $0.00000292, climbing inside an ascending channel on the daily chart.
-
Break above the channel with volume and $0.00000344 opens up, then $0.00000385.
-
Lose the channel's lower boundary instead, and price likely falls to $0.00000255, then $0.00000223.
-
On the 4-hour chart, an ascending triangle is forming right beneath resistance at $0.00000296.
-
Short liquidations outpaced longs over the past 24 hours, a sign shorts got caught leaning wrong.
Technical Analysis of $PEPE
4-Hour Chart Analysis
Zooming into the 4-hour, PEPE is forming an ascending triangle just under resistance at $0.00000296, a rising support line pushing price up against a fairly flat ceiling.
That's typically a continuation setup rather than a reversal one. 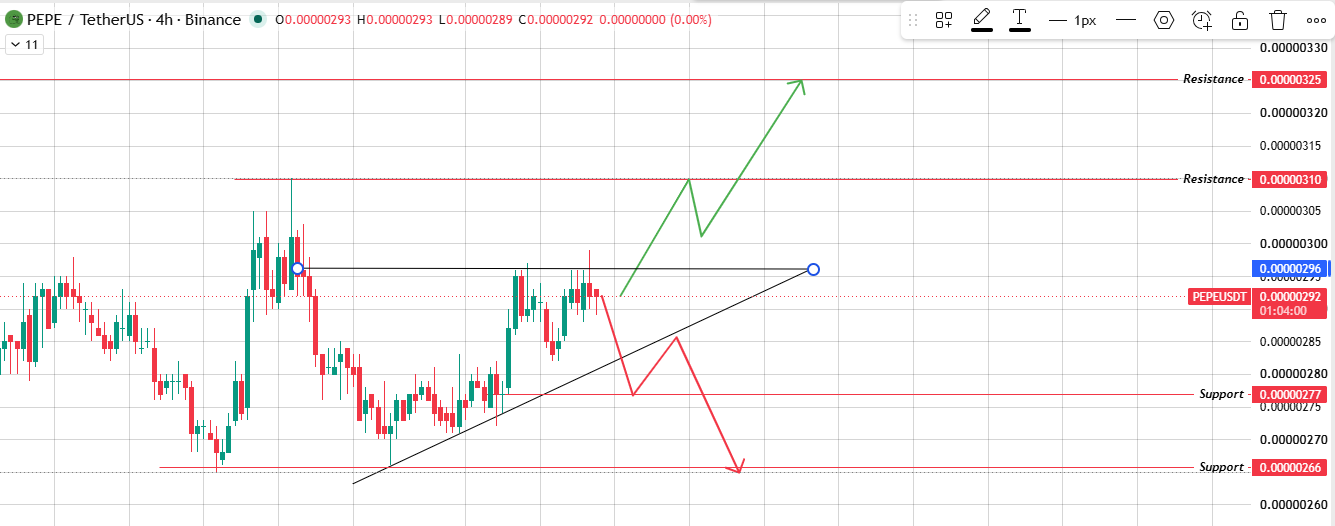
Source: Chart Taken From TradingView.
Clear that resistance level with volume, and $0.00000310 comes into view fast, followed by $0.00000325.
If the rising support line breaks down instead, expect a slide toward $0.00000277, then $0.00000266 below that.
This triangle is tightening. It shouldn't stay quiet much longer.
Daily Chart Analysis
PEPE has been climbing steadily inside an ascending channel for a while now, both boundaries sloping upward together, higher lows stacking on higher lows. 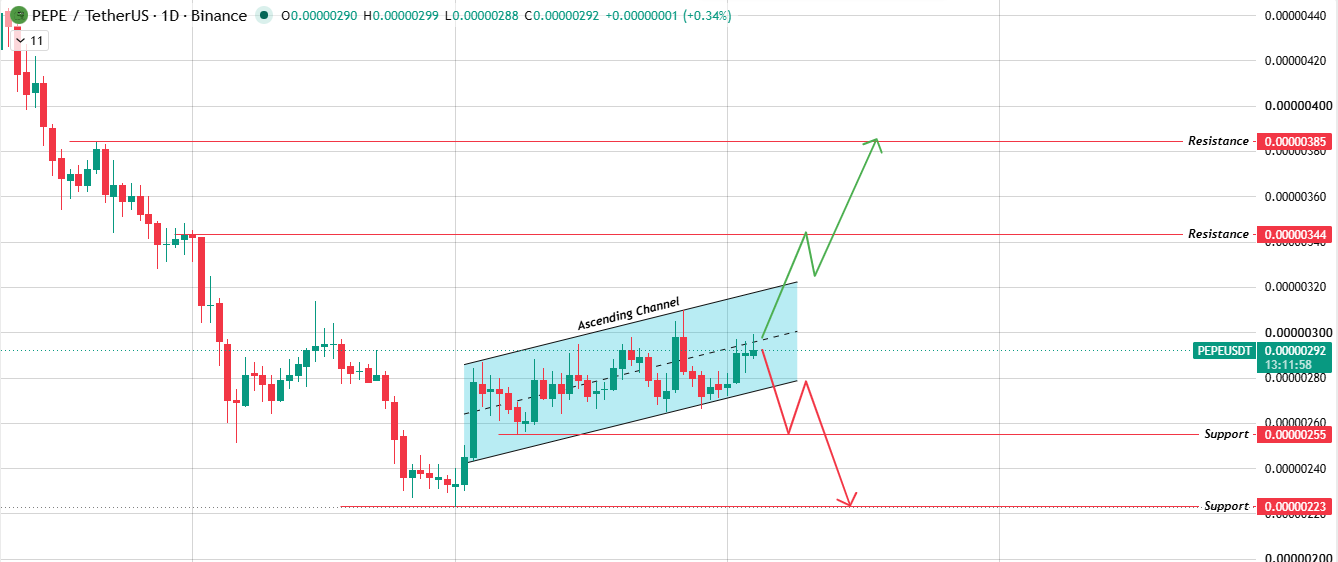
Source: Chart Taken From TradingView.
That's a healthy structure so far. Break above the channel's upper boundary with real volume, and the price should push toward the resistance level at $0.00000344, with $0.00000385 as the stretch target if momentum keeps building.
Slip below the channel's lower boundary instead, and PEPE likely drops to the support zone at $0.00000255, then $0.00000223 underneath that if selling really picks up.
As long as the channel holds, the bias here stays tilted bullish.
Bull, Base, and Bear Case
What kills the bull case? A hard rejection at $0.00000344 on heavy sell volume. What kills the bear case? Buyers defending the channel's lower boundary and holding it.
Catalysts to Watch
The ascending channel holding or breaking is the central story for this Pepe price prediction right now.
Beyond the chart itself, PEPE's price target tends to move alongside broader meme coin sentiment, and that sentiment usually improves when BTC dominance is falling and altcoins get more room to run.
ETH correlation matters less for $PEPE specifically, given it trades more on its own momentum and social attention than on Ethereum ecosystem news.
Watch for a volume spike the moment the price tests either the channel's upper boundary or the 4-hour triangle resistance, since a move without volume behind it tends to fade quickly.
Analyst Forecasts
There's no single headline call driving $PEPE sentiment this cycle, more a market that's been quietly grinding higher inside its own channel while shorts keep getting squeezed out along the way.
That short liquidation imbalance over the past 24 hours technically favors the bulls, since it shows sellers haven't been able to hold their positions as price climbed.
Whether that continues depends heavily on whether the ascending channel and the 4-hour triangle both resolve in the same direction, which would give this move real confirmation rather than just short-term noise.
Long-Term Outlook
Stepping back, $PEPE has proven more durable than most meme coins from its launch era, still holding a spot among the largest tokens in the category two years later.
That staying power says something about community strength even without any underlying utility.
Long-term, $PEPE's path likely keeps tracking broader meme coin cycles and general risk appetite across crypto more than any PEPE-specific development.
A sustained hold above the ascending channel would be an encouraging technical signal, but reclaiming higher ground probably takes several more weeks of consistent buying rather than one breakout candle.
Glossary
Ascending Channel: Two parallel lines both sloping upward, tracking a series of higher highs and higher lows until price eventually breaks out of the structure.
Ascending Triangle: Flat resistance sitting above rising support, squeezing price toward the ceiling until it either breaks through or fails.
Support Zone / Resistance Level: Chart areas where buying or selling has shown up with enough force before to pause or reverse where price is heading.
Liquidation Heatmap: A map of where over-leveraged long and short positions get forced closed as price crosses certain levels.
BTC Dominance: Bitcoin's share of the total crypto market cap, a quick gauge of how much room meme coins and altcoins have to run.
Methodology: price levels sourced directly from 1D and 4H TradingView charts; liquidation and volume data sourced from Coinglass; no data extrapolated beyond visible chart structure.
Disclaimer: This article is for informational purposes only and does not constitute financial advice. Cryptocurrency markets, including PEPE, are highly volatile and speculative. Price levels discussed are derived from technical chart analysis of TradingView data as of August 4, 2026, and are probability-based scenarios, not guarantees. Always conduct independent research and consult a licensed financial advisor before making investment decisions.


















