Pi Network Price Prediction: Can PI Follow Bitcoin’s Path to Success?


People mocked Bitcoin at $0.10, then again at $1, one post on X says, and now it asks if the same story is playing out for PI. Another post asks if the Pi Core Team is still backing gaming.
This Pi Network Price Prediction covers both posts and the levels on the chart.
Market data checked on October 13, 2026 at 04:28 UTC-3.
Pi Network Price Prediction Today: Market Overview
Metric | Value |
Price (OKX) | $0.08027 |
Change | -3% |
Why is PI’s price down today?
Pi Network price today is down -3% to $0.08027 in 24h, underperforming a slightly positive Bitcoin, primarily driven by a technical breakdown from key moving averages.
Primary reason: Bearish technical momentum, with price trading below its 50-day and 200-day Exponential Moving Averages (EMAs).
Secondary reasons: Elevated selling volume, which spiked 118% to $6.52M, confirming the downward pressure.
Pi Network News Today: Post Asks If Pi Is Still Bullish on Gaming
A post on X asks if the Pi Core Team is still bullish on gaming. "Bullish" means expecting prices to rise.
It says Pi Ventures' investment into CiDi Games was announced nearly a year ago and promises to explain what drove that long-term decision. The graphic reads "Pi Ventures Invests in CiDi Games Alongside Gaming Partnership."
Source: Data From X
CoinGabbar could not verify the investment terms or any link to the PI price.
PI News: Post Asks If History Is Repeating
A post by Pi Update on X says people mocked Bitcoin at $0.10, then again at $1, and many now wish they had taken it seriously sooner. It asks if history could repeat with $PI.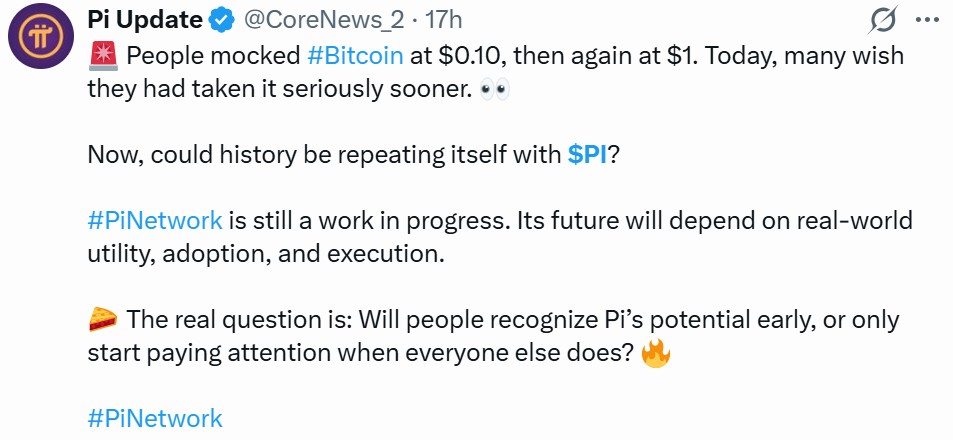
The same post adds that Pi Network is still a work in progress and that its future depends on real-world utility, adoption and execution.
CoinGabbar could not verify the comparison. The chart also adds a caution: $PI trades about 43% below its June high near $0.14.
PI Technical Analysis
PI fell from near $0.14 in June to a low near $0.07021 in July. It then moved sideways through August and September, with a spike near $0.11 in late August.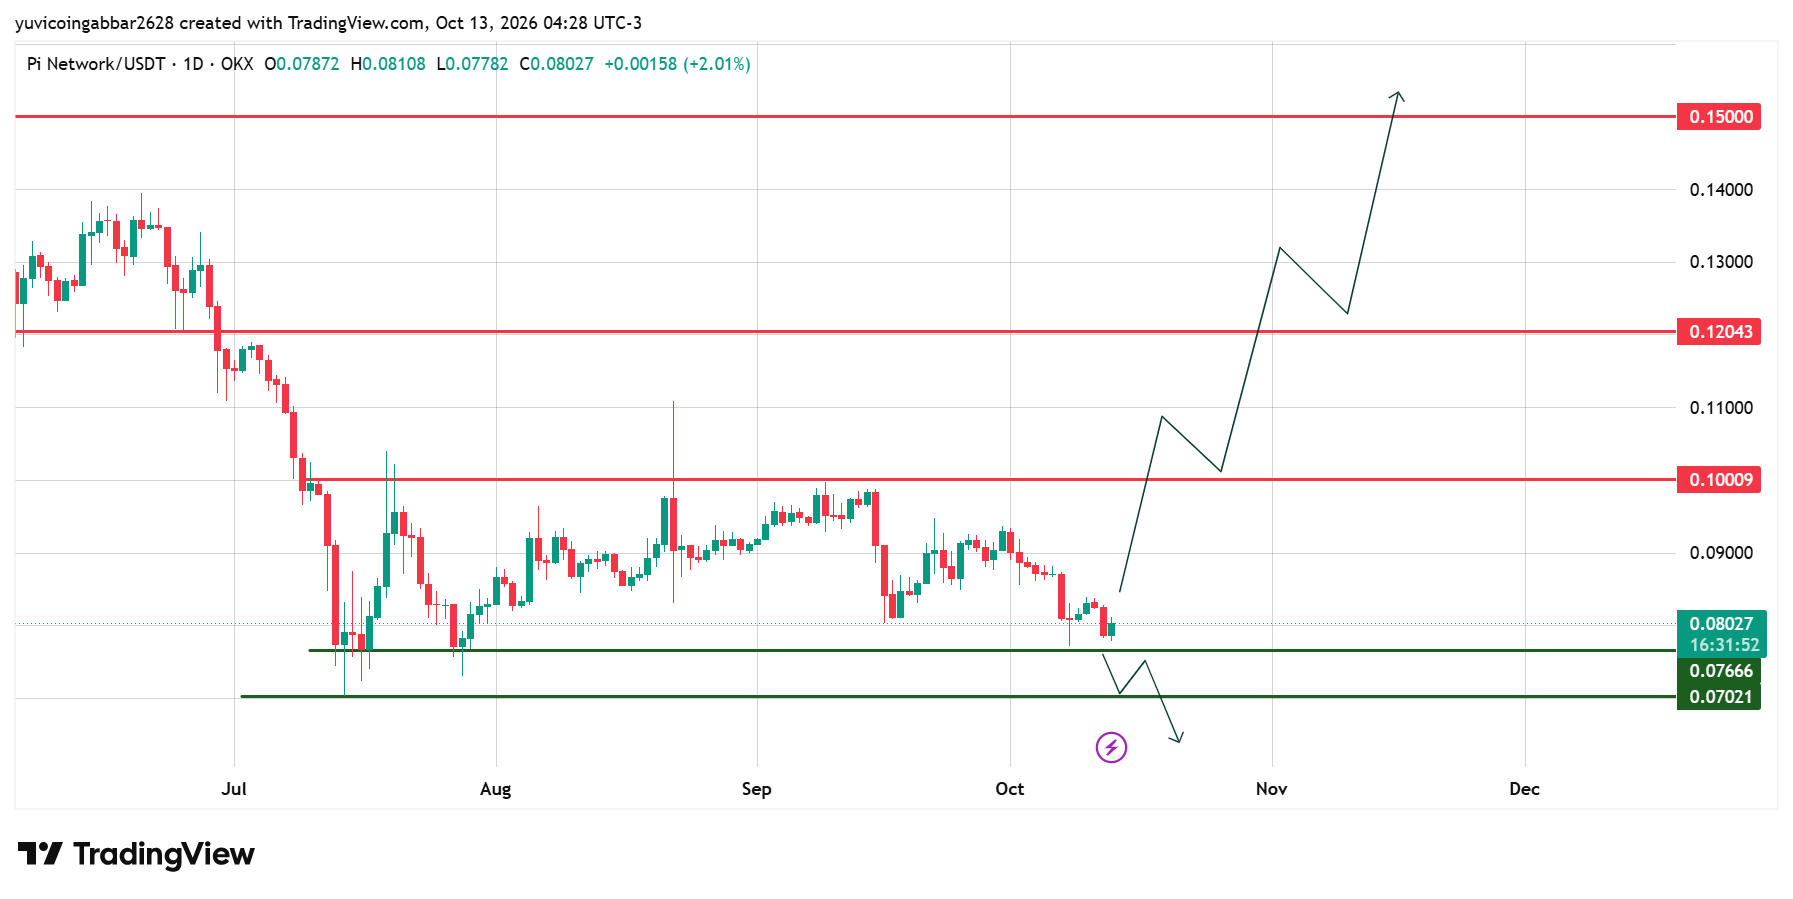
Price stalled just under $0.10009 in September and slid in early October. Today's candle held above the marked $0.07666 support and bounced to $0.08027.
$PI Support and Resistance Levels in This PI Forecast
Level | Type |
$0.15000 | Resistance (highest marked) |
$0.12043 | Resistance |
$0.10009 | Resistance (nearest marked) |
$0.07666 | Support (first) |
$0.07021 | Support (deeper) |
PI Bull Case and Bear Case
Bull case: A daily close above $0.10009 would be the first clear sign of strength. $PI stalled under that level in September, so clearing it would show buyers have taken control, with $0.12043 next.
Holding above $0.07666 meanwhile keeps that path open.
Bear case: If $PI closes below $0.07666, the first marked support, the bounce would weaken and the price could slide toward $0.07021.
$PI also sits about 43% below its June high, and neither post offers data that changes that picture. A close back above $0.07666 would cancel this view.
Triggers and Invalidation
Scenario | Trigger | Likely Outcome | Invalidation |
Support hold | Closes stay above $0.07666 | Range below $0.10009 | Close below $0.07666 |
Resistance break | Close above $0.10009 | Move toward $0.12043 | Close back below $0.10009 |
Support breakdown | Close below $0.07666 | Slide toward $0.07021 | Reclaim $0.07666 |
A close is the price where a daily candle finishes.
Pi Network Price Prediction: Can $PI Reach $0.15?
$PI would need to pass $0.10009 and $0.12043 first. A move to $0.15000 from $0.08027 is a gain of about 87%, and the price stalled below the first of those levels in September.
Pi Network Price Prediction: Expert View
According to CoinGabbar analysts, both posts lean on a story, not on data from the chart. $PI trades above $0.07666 for now, with $0.10009 as the level that held it back in September. The next daily close near $0.07666 will show which side has control.
Disclaimer
This article is for informational purposes only and is not financial advice. Crypto markets are volatile. Do your own research before making any trading decisions involving PI.

















