Pons Price Prediction: PONS Eyes $1 After 491% Weekly Rally


Pons is changing hands near $0.6938, up 43.79% on the day, and this Pons price prediction digs into whether that strength can carry through or whether traders searching for a Pons price prediction today are looking at a market that has already moved too far too fast.
The token has climbed 491.50% over seven days, lifting its market capitalization to roughly $482.13M on a circulating supply of 706.37M tokens out of a 1B max supply.
Why Is Pons Up? What’s Driving the Move
Market sentiment around $Pons shifted after a fee milestone flagged in a BSCNews fee report. $Pons generated $5.95 million in 24-hour fees, moving past Pumpfun's $4.64 million and Robinhood Chain's $4.45 million.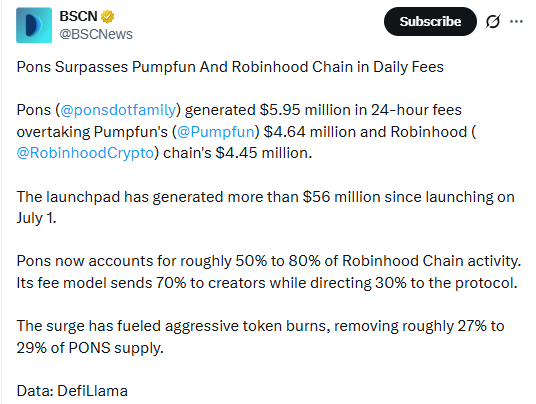
The launchpad has generated more than $56 million in fees since launching on July 1, and Pons now accounts for roughly 50% to 80% of Robinhood Chain activity, with its fee model routing 70% to creators and 30% to the protocol.
This kind of usage growth is one of the clearer fundamental threads feeding into the current Pons price prediction.
That fee surge has also fed an aggressive token burn mechanism, which has reportedly removed close to 27% to 29% of $PONS supply.
Combined with steady ecosystem growth on the underlying chain, that shrinking float has compounded the demand-side buying rather than working against it.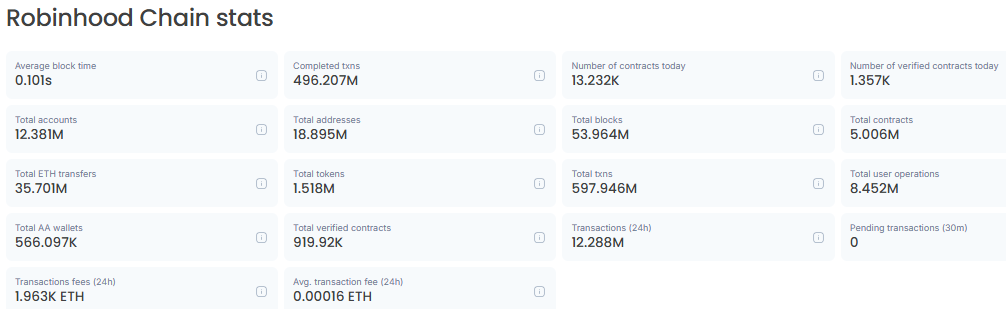
The chain-level numbers support the sentiment shift too, per Blockscout's network stats.
Robinhood Chain is processing over 12.28 million transactions in the past 24 hours alone, with nearly 496 million completed transactions total and more than 12.3 million total accounts, pointing to real trading activity rather than an isolated speculative spike.
Derivatives Show a Squeeze, Not Just a Rally
This side of the Pons price prediction leans heavily on Coinglass derivatives data. Open interest has climbed from roughly $20M in early September to $79.29M as of the latest reading, with price and open interest rising almost in lockstep.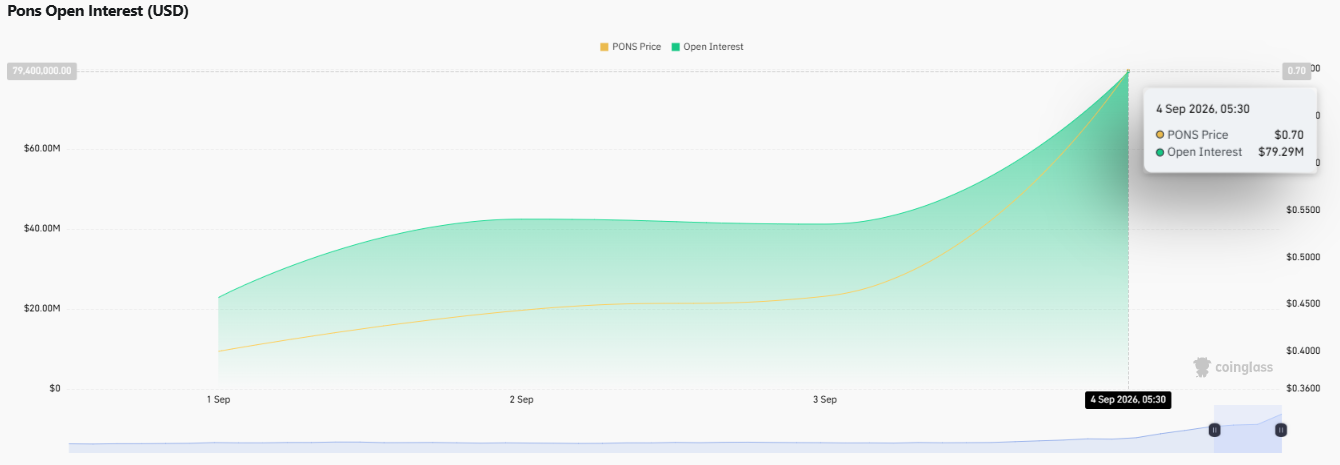
That kind of parallel expansion in market structure usually signals fresh leveraged positioning entering the market rather than existing traders simply rotating capital.
According to Coinglass liquidation data, $2.06M in positions were wiped out over the last 24 hours, and $1.95M of that came from short sellers, versus just $106.02K in long liquidations.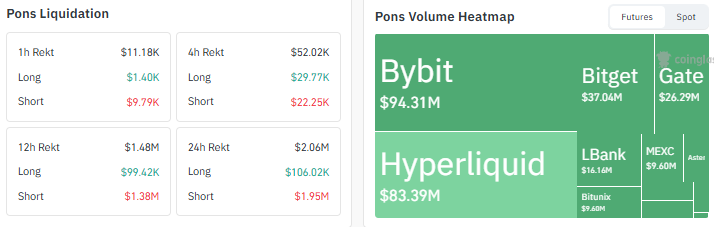
Shorts dominated liquidations across the 1h, 4h, and 12h windows as well, a lopsided profile that points to a genuine short squeeze acting as a crypto market catalyst behind part of this move, as traders positioned against $Pons were forced to close out into rising price.
Per Coinglass's volume heatmap, trading volume has been broad-based rather than concentrated on one venue.
Bybit leads futures activity with $94.31M, followed by Hyperliquid at $83.39M, with meaningful trading activity also spread across Bitget, Gate, LBank, MEXC, and Bitunix.
Buying pressure spread across that many venues, both centralized and decentralized-leaning, lowers the odds that the move is an artifact of a single thin order book.
How Far Has PONS Actually Come
Per Coinglass price performance data, $PONS is up 0.91% on the 4-hour chart and 43.21% on the 24-hour chart, while the 7-day gain sits at 491.50%. Longer windows, including the 30-day, 90-day, 180-day, year-to-date, one-year, and all-time figures.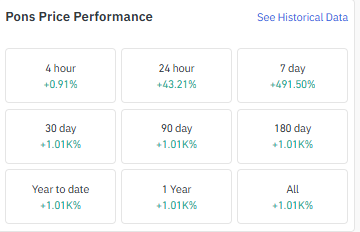
All cluster around the 1,010% mark, which says less about the long-term trend and more about how compressed this entire advance has been into the past few weeks.
PONS Daily Chart: Reading the Breakout Levels
Per TradingView chart data, $PONS spent an extended stretch in consolidation before breaking into a rising channel.
From that channel, the token cleared resistance at 0.245491, then 0.362489, then 0.459713, printing a clean sequence of higher highs as each level flipped from resistance into support along the way.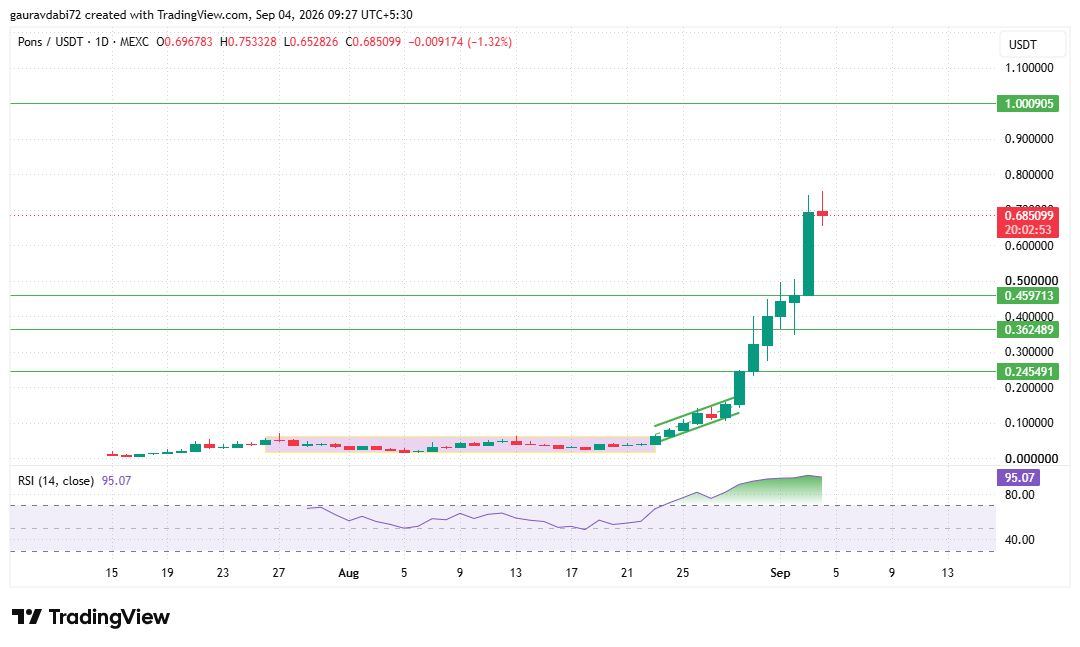
The next resistance zone on the chart sits at 1.000905, and price action holding above the prior breakout levels is what would keep that zone in play.
The RSI (14) on the daily timeframe, per the TradingView chart, is reading 95.07. That's an extremely overbought level, and it reflects just how much price momentum has built up in a short window.
A high reading like this doesn't automatically end an uptrend, but it does raise the odds of a sharp pullback or a period of consolidation before PONS price prediction today searches start pointing to fresh highs again.
On the support side, the former resistance levels at 0.459713, 0.362489 and 0.245491 now double as the key zones to watch on any retracement, with the breakout channel's lower boundary acting as a broader structural floor beneath them.
Where PONS Could Go From Here
This Pons price prediction stays conditional rather than fixed, since traders asking whether $PONS can hit $1 are really asking whether buying pressure and the short squeeze dynamic can outlast the current overbought reading.
If Pons holds above the 0.459713 zone, a move toward the 1.000905 resistance area is plausible without being guaranteed.
If selling pressure picks up instead, a cooldown back toward 0.362489 or 0.245491 wouldn't be surprising and would likely be read as healthy given how fast the advance has been.
Open interest and liquidation data will matter as much as price action here, since a sudden reversal in either would be an early sign that the squeeze-driven leg is running out of fuel.
Expert Opinion
As per the CoinGabbar analyst desk, the combination of a genuine fee and usage milestone, an active burn mechanism reducing float, and a derivatives market where shorts are getting run over is a powerful short-term mix, but it is also the kind of setup that tends to run hot rather than climb in a straight line.
The RSI reading alone suggests the easy part of this move may already be behind it, and the more informative signal going forward will be how price behaves the first time it tests the 0.459713 support rather than how far it extends above current levels.
The Bottom Line
Pons has gone from a quiet consolidation to one of the more notable movers in the market over the past week, backed by real fee generation, active token burns, and a squeeze in derivatives positioning.
Overall, this Pons price prediction points to a market structure that remains constructive above the 0.459713 to 0.245491 support band, with 1.000905 as the level to watch on the upside, though the overbought RSI reading means volatility in both directions should be expected near term.
Anyone asking is PONS a good investment right now should weigh that upside against just how stretched the short-term chart has become.
Disclaimer: This article is for informational purposes only and does not constitute financial advice. Cryptocurrency markets are highly volatile, and readers should conduct their own research before making any investment decisions.
Also read:
















