Pons Price Prediction: Why Price is Up 17% Today, Reason & 10x Growth?


The PONS coin price is the one everyone in crypto circles is refreshing right now, after a violent short squeeze sent the PONS crypto token ripping higher in a matter of hours.
Searches for $PONS launchpad, PONS Robinhood, and PONS meme coin have all spiked alongside it.
This Pons price prediction breaks down what actually happened, who got liquidated, and the levels that decide if the $PONS token has more room to run. Stick around, because the next move could go either way.
Market data was checked on September 3, 2026, at 11:46 IST.
Pons Price Prediction Today: Market Overview
| Metric | Value |
| Price | $0.48730 |
| 24h Change | +17% |
| Market Cap | $342.73M |
| FDV | $484.99M |
| 24h Volume | $112.11M |
| Vol/Mkt Cap (24h) | 31.93% |
| Liq/Mkt Cap | 6.31% |
| Total Supply | 706.67M $PONS |
| Max Supply | 1B $PONS |
| Circulating Supply | 706.67M $PONS |
Source: Data from CoinMarketCap as of September 3, 2026, at 11:46 IST. Figures may vary slightly across other tracking websites.
$PONS Liquidation and Volume Data
Short sellers took the brunt of the damage over the past day.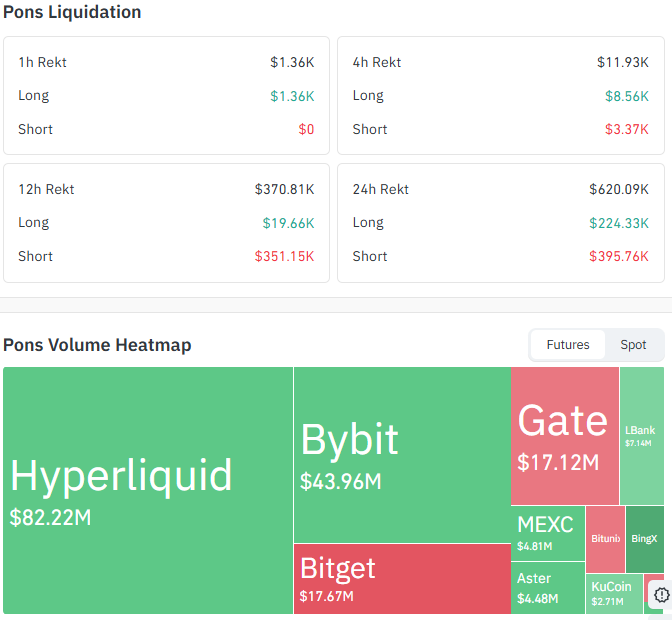
Source: Data From CoinGlass
$PONS liquidated $620.09K in total over 24 hours, split between $224.33K in long liquidations and $395.76K in short liquidations, a sign that traders betting against the move got forced out as price ran higher.
The 12-hour window shows the squeeze even more clearly, with $351.15K in shorts wiped out against just $19.66K in longs.
Futures volume is concentrated on Hyperliquid at $82.22M and Bybit at $43.96M, with Bitget at $17.67M, Gate at $17.12M, and MEXC and smaller venues rounding out the rest.
Pons Price Prediction 2026: $PONS Chart Analysis
Pair: $PONS/USDT · Market: Crypto · Timeframe: 4H · Source: TradingView · Timestamp: September 3, 2026, 11:46 UTC+5:30
$PONS rallied sharply off its recent range, touching a high of $0.5232 before pulling back to consolidate around $0.48730, just under the $0.52397 resistance line.
The broader structure is still bullish, with the chart printing higher highs and higher lows since late August.
As long as $PONS holds above support and stays inside this structure, the trend favors continuation, so the key levels above and below current price are worth watching closely. 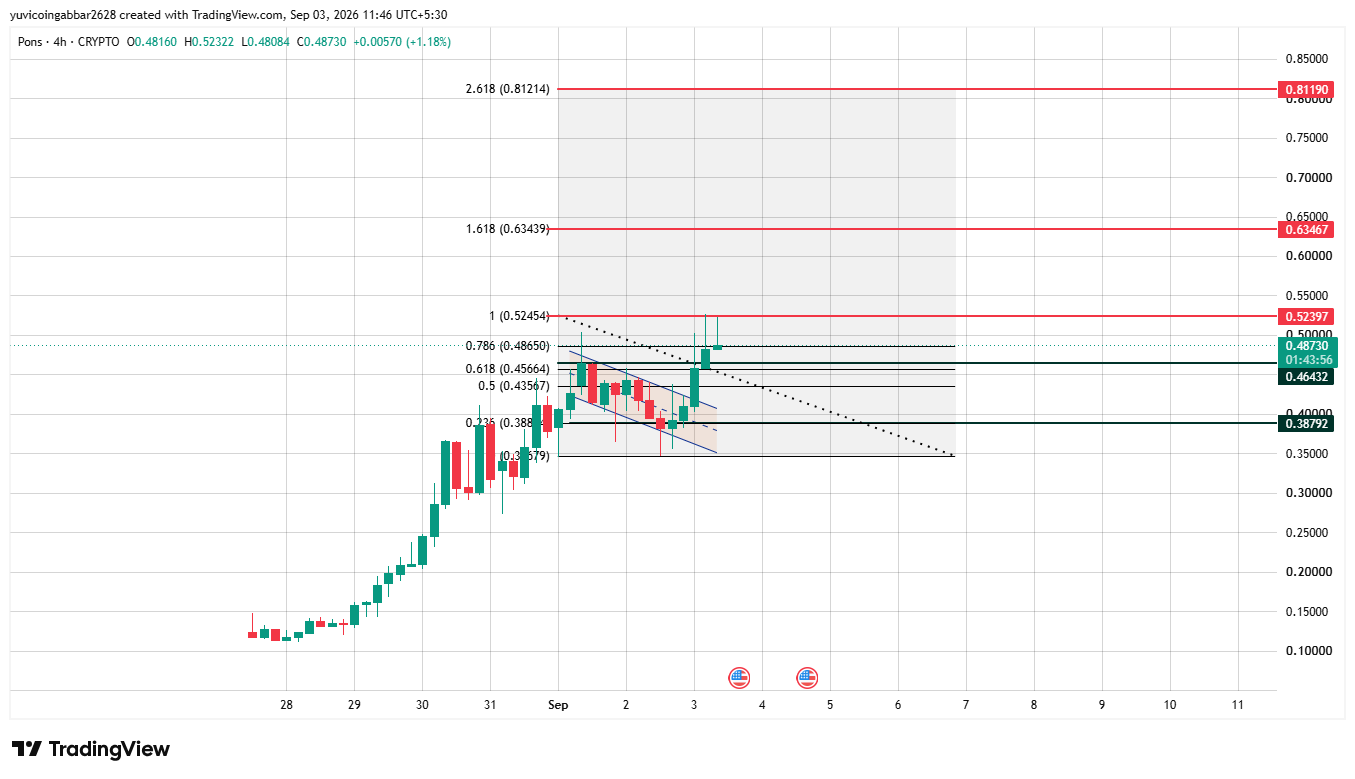
Pons Price Prediction: Key Levels
| Level | Price |
| Resistance 3 | $0.81190 |
| Resistance 2 | $0.63467 |
| Resistance 1 | $0.52397 |
| Immediate Price Reference | $0.48730 |
| Support 1 | $0.46432 |
| Support 2 | $0.38792 |
Bull Case vs Bear Case
Bull case: Clearing resistance 1 at $0.52397 keeps the squeeze narrative alive and opens the door toward $0.63467.
Bear case: A close below support 1 at $0.46432 would put the breakout in doubt, with support 2 at $0.38792 as the next downside level.
Can $PONS Reach $0.81190?
$0.81190 is the highest level on the chart.
Getting there would take $PONS clearing $0.52397 first, then holding above the $0.63467 extension, a multi-stage move rather than a single leg from here.
$PONS vs Bitcoin: How the Move Compares
Bitcoin price action has been comparatively quiet this week, with most bitcoin price prediction chatter centered on consolidation rather than a breakout.
$PONS is a different story. A 17% daily move on volume equal to nearly a third of its market cap is the kind of swing BTC rarely makes anymore at its size, but it's common for smaller launchpad tokens riding a short squeeze.
The takeaway: $PONS carries far more upside and downside in a single day than Bitcoin does, so position size should reflect that gap in volatility.
Pons Price Prediction: Expert View
According to CoinGabbar analysts , The liquidation data backs up the price action. Shorts got forced out, not longs, and that kind of squeeze often has some follow-through left.
The $0.46432 to $0.52397 zone is what decides whether this holds.
Disclaimer
This article is meant to inform, not to tell you what to do with your money. The levels covered here come from chart analysis and data that was public at the time of writing, and $PONS has already shown how fast that can change in a single day. Treat this as one input among many, do your own research, and only risk what you can afford to lose.
















