Pump.Fun Price Prediction: Is $PUMP Gearing Up For a Breakout Rally?


Pump.fun launched as the platform behind the meme coin creation boom, and its native Pump.fun token, has swung wildly since its debut, tracing a deep multi-month drawdown before carving out a rounded recovery base.
Today $PUMP trades around $0.004937, holding a Pump.fun market cap near $1.928B against a circulating supply of 389.892B tokens out of a 1T max supply.
This Pump.fun price prediction, more broadly, looks at whether that base can now fuel a sustained move higher.
Live Market Data
Metric | Value |
Price | $0.004937 |
24h Change | -3.1% |
24h Range | $0.004918 - $0.005399 |
Market Cap | $1.928B |
Fully Diluted Valuation | $4.145B |
24h Trading Volume | $365.912M |
Total Value Locked | $318.038M |
Circulating Supply | 389.892B |
Total Supply | 838.154B |
Max Supply | 1T |
Volume Heatmap
Binance leads $PUMP trading activity, and Binance volume alone comes in at $500.35M, followed by OKX at $292.96M and Hyperliquid at $175.21M. 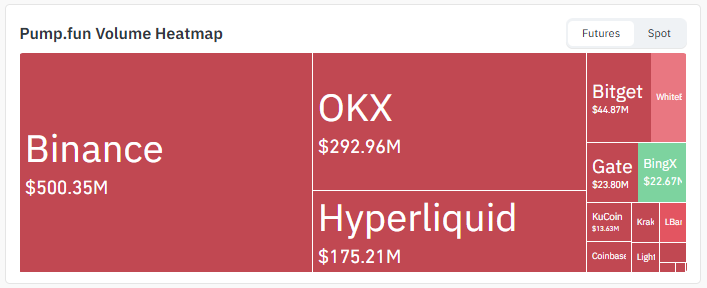
Source: Volume Heatmap Data Taken From Coinglass.
Bitget, Gate, and BingX round out the next tier with $44.87M, $23.80M, and $22.67M, respectively, while KuCoin, Kraken, LBank, and Coinbase hold smaller shares.
This PUMP trading volume concentration on Binance and OKX suggests deep liquidity backing this move rather than thin, easily reversible volume.
Liquidation Data
$PUMP traders have felt this move on both sides. In the last hour alone, $83.24K was liquidated, almost entirely from longs caught by the pullback.
Over 24 hours, total liquidations reached $3.67M, with longs accounting for $2.07M and shorts for $1.60M. 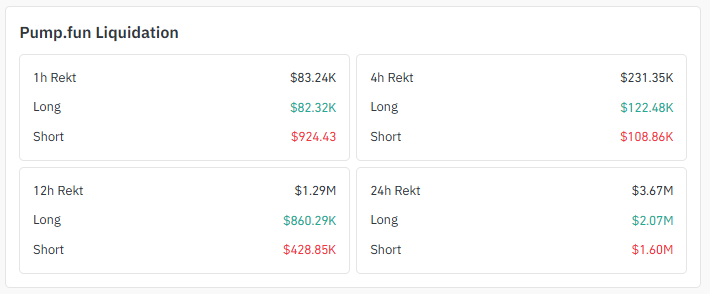
Source: Liquidation Data Taken From Coinglass.
The 12h window tells a similar story at $1.29M total, with longs bearing the bigger share at $860.29K against $428.85K in shorts.
This lopsided liquidation data pattern typically shows up right after a sharp spike, when late buyers get squeezed on the retrace.
Key Takeaways
PUMP is trading near $0.004937 today, down 3.1% after a sharp breakout move, and PUMP price today remains a hot topic among traders.
The daily chart shows price emerging from a long rounding bottom pattern and clearing an ascending channel on rising volume.
Price is now dipping to retest a fair value gap (FVG) near 0.0045-0.0050, a zone that could decide the next leg of this Pump.fun price prediction.
A bounce and resistance break could send PUMP toward $0.007526, while rejection risks a slide back toward the rounding structure boundary.
Over $3.67M in PUMP positions were liquidated in the last 24 hours, split heavily toward longs.
Technical Analysis
$PUMP Rounding Bottom Pattern
This chart analysis shows $PUMP spent months carving a rounded, saucer-shaped base after its early collapse from the launch spike.
Price has now closed decisively above that curved boundary, the rounding bottom pattern, which is usually read as a sign that sellers have finally lost control of the trend.
Volume picked up meaningfully on the move, adding weight to the breakout rather than leaving it looking thin or unconvincing.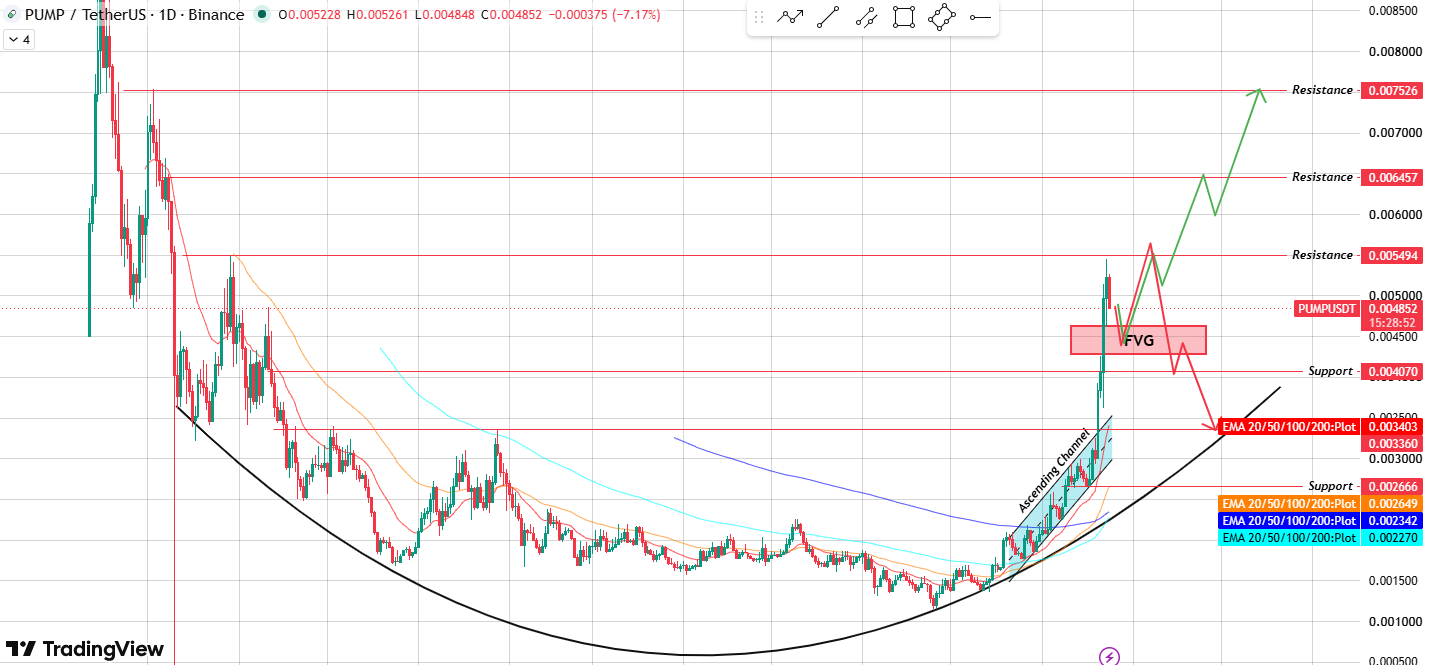
Source: Chart Taken From TradingView.
Ascending Channel Breakout
Layered on top of the rounding structure, $PUMP built a tight ascending channel through August.
Price pushed through the upper boundary of that channel on strong volume, confirming a genuine PUMP breakout rather than a fakeout.
That said, sharp channel breaks tend to invite a pullback before the next push, which is exactly what appears to be unfolding now.
The FVG Retest
Right where the price broke out sits an unfilled FVG between roughly $0.0045 and $0.0050. PUMP is dipping back into this zone to test it.
How price behaves here matters more than the breakout itself for this PUMP price target, since a clean bounce would confirm demand while a hard break below it would undo the bullish structure.
Two Paths From Here
If buyers step in at the FVG and PUMP reclaims and closes above $0.005494, the path opens toward $0.006457 and then $0.007526.
If instead the price gets rejected at that resistance or the FVG fails to hold, $PUMP likely slides back toward the EMA cluster near $0.0034 and retests the rounding bottom's upper boundary around $0.002666 before any fresh attempt higher.
EMA Levels
EMA | Value |
EMA 20 | $0.003403 |
EMA 50 | $0.002649 |
EMA 100 | $0.002342 |
EMA 200 | $0.002270 |
Price sitting well above all four EMAs on the daily timeframe supports the broader bullish structural shift, even with the short-term dip into the FVG.
Support and Resistance Levels
resistance levels and support levels drawn from the daily chart are laid out below.
Level Type | Price |
Resistance 3 | $0.007526 |
Resistance 2 | $0.006457 |
Resistance 1 | $0.005494 |
Support 1 | $0.004070 |
Support 2 | $0.002666 |
Bull Case, Base Case, and Bear Case
Case | Level Zone | Setup |
Bull Case | $0.006457 - $0.007526 | FVG holds as support, resistance at $0.005494 breaks with volume, and the PUMP breakout confirms |
Base Case | $0.004070 - $0.005494 | Price chops inside the FVG zone, with no clean break on either side, and the range persists. |
Bear Case | $0.003403 - $0.002666 | Rejection at $0.005494, FVG fails, price falls back toward the EMA cluster and rounding bottom pattern edge |
Invalidation for the bull case sits below $0.004070. Invalidation for the bear case sits above $0.005494 on a daily close basis.
Glossary
Fair Value Gap (FVG): Ever seen a candle just skip a price range like it wasn't even there? That's an FVG. Markets tend to come back and "fill" these gaps before they commit to the next real move.
Ascending Channel: Two parallel lines, price bouncing between them, grinding higher step by step. Simple pattern, but traders watch the upper line closely because that's usually where the breakout attempt happens.
Rounding Bottom: This one takes patience. No sharp V-shaped reversal here, just a slow curve where sellers gradually run out of steam and buyers quietly take over. Weeks, sometimes months, in the making.
EMA: Short for Exponential Moving Average. Unlike a plain average that treats every candle equally, EMA leans harder on what's happened recently, so it reacts faster when momentum shifts.
Liquidation: The point where a leveraged trade gets closed out by force because margin ran dry. Painful for whoever's on the wrong side of it, and it's exactly what drives those liquidation spikes you see after a sharp move.
Methodology
Nothing here is guesswork pulled from thin air. Every level in this PUMP coin price prediction comes straight off the daily chart, the rounding bottom, the ascending channel, and the FVG, all of it read directly off price action.
Market data, exchange volume splits, and liquidation numbers get cross-checked against Coinglass and TradingView before anything makes it into the article. If a target can't be traced back to an actual chart level, it doesn't go in.
Disclaimer: This article is for informational purposes only and does not constitute financial advice. Cryptocurrency markets are highly volatile, and this Pump.fun price prediction should not be treated as a guarantee of future price movement. Always do your own research and consult a licensed financial advisor before making investment decisions.
Also read:












.webp)




