Pump.Fun Price Prediction: Will $PUMP Extend Its Recent Rally?

This Pump.Fun Price Prediction starts with the current picture: PUMP, the token tied to the Pump.fun launchpad platform, is Currently trading around $0.004521 today, up over the last 24 hours.
It remains one of the more actively traded newer tokens by volume, with traders watching closely for its next directional signal.
Live Market Data
Metric | Value |
Price | $0.004521 |
24h Change | +5.0% |
24h Range | $0.004261 - $0.004681 |
Market Cap | $1.79B |
Outstanding Token Value | $2.695B |
Fully Diluted Valuation | $3.779B |
24h Trading Volume | $178.492M |
Total Value Locked | $344.515M |
Circulating Supply | 396.105B |
Outstanding Supply | 596.235B |
Total Supply | 836.235B |
Max Supply | 1T |
Source: $PUMP market cap data taken from CoinGecko, data as of Sep 01, 2026. Figures may vary slightly across other tracking websites.
Exchange Volume
PUMP futures volume is heavily concentrated on the larger exchanges.
Binance leads with $170.80M, followed by OKX at $152.55M and Hyperliquid at $72.33M. WhiteBIT ($13.16M), BingX ($12.15M), and KuCoin ($7.08M) make up a smaller share, alongside contributions from Bitget, Gate, and other venues. 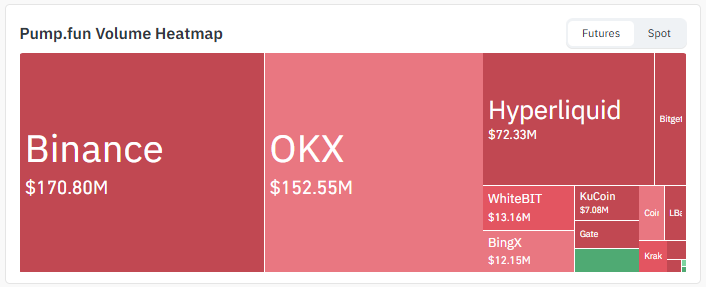
Source: Volume Heatmap Data Taken From Coinglass.
This concentration on major platforms points to institutional and high-volume trader participation alongside retail flow.
Liquidation Snapshot
Timeframe | Total Liquidated | Longs | Shorts |
4h | $139.09K | $8.42K | $130.67K |
12h | $761.84K | $65.04K | $696.80K |
24h | $1.11M | $199.65K | $912.07K |
Source: Liquidation Data Taken From Coinglass.
Short positions have absorbed the bulk of the liquidation pain across every window studied here. That lines up with PUMP's recent upward push catching bearish bets off guard.
Key Takeaways
PUMP trades near $0.004521, up 5.0% over the past 24 hours, and is currently forming a symmetrical triangle on the daily chart.
A daily close above the triangle's falling trendline, backed by volume above the recent daily average, would open the path toward $0.005499, $0.006457 and $0.007526.
A daily close below the triangle's rising trendline would shift focus toward $0.004165, $0.003686, and $0.002983.
RSI sits at 60.83, above its own moving average of 72.82, showing momentum has cooled slightly from its recent peak.
24-hour liquidations lean heavily toward shorts, with $912.07K wiped out versus $199.65K in longs.
Technical Analysis
How Did PUMP Get Here?
PUMP spent an extended stretch carving out a rounded bottom on the daily chart.
This slow curve marked the shift from selling pressure to accumulation. Out of that base, price entered a descending channel and broke its upper boundary. 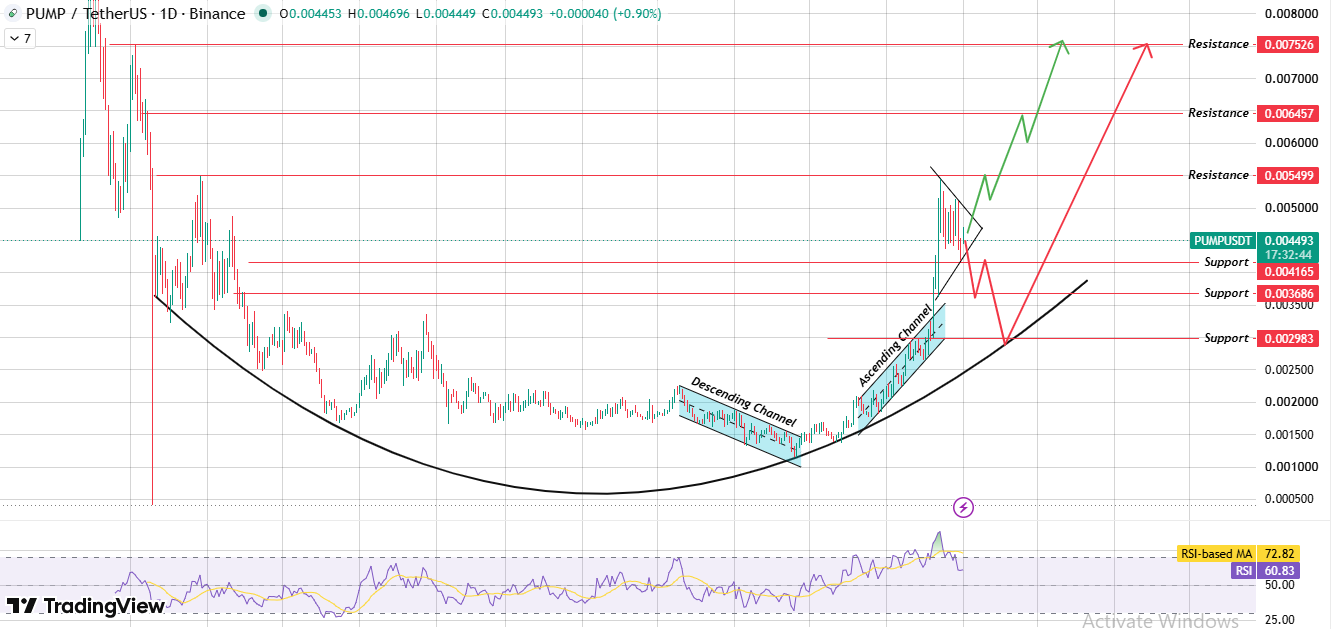
Source: Chart Taken From TradingView.
It then formed an ascending channel and broke that boundary too. Each break was followed by a sharp upward push, building the structure $PUMP trades in today.
What Pattern Is PUMP Forming Now?
After that last sharp rally, $PUMP pulled back into a symmetrical triangle. In this pattern, the highs are falling and the lows are rising toward a single point.
Price is currently trading inside this triangle, and the two converging trendlines are what will decide the next move.
Is Momentum Still Supportive?
RSI reads 60.83 today, below its own moving average of 72.82. That gap suggests momentum has eased from its recent high.
The reading still sits above the neutral 50 mark, though, so buying pressure has not disappeared entirely.
What Happens On A Break Above The Triangle?
A daily candle that closes above the triangle's falling upper trendline, supported by volume higher than the recent daily average, would confirm a bullish breakout.
That scenario points first toward $0.005499, then $0.006457, with $0.007526 as the extended target.
What Happens On A Break Below The Triangle?
If PUMP instead closes a daily candle below the triangle's rising lower trendline, that would confirm a bearish breakdown.
The first support to watch in that case is $0.004165, followed by $0.003686 and $0.002983 further down.
Support & Resistance Levels
Type | Level |
Resistance 3 | $0.007526 |
Resistance 2 | $0.006457 |
Resistance 1 | $0.005499 |
Support 1 | $0.004165 |
Support 2 | $0.003686 |
Support 3 | $0.002983 |
Bull, Base & Bear Case
Scenario | Target Levels | Trigger | Invalidation |
Bull Case | $0.005499 $0.006457 $0.007526 | Daily close above the triangle's upper (falling) trendline with volume above the recent daily average | Daily close back inside the triangle |
Base Case | $0.004165 - $0.005499 range | Price stays boxed inside the triangle, oscillating between both trendlines. | Break of either trendline on a daily close |
Bear Case | $0.004165 $0.003686 $0.002983 | Daily close below the triangle's lower (rising) trendline | Daily close back above $0.005499 |
Note: All levels are chart-derived from the daily PUMP/USDT timeframe. This is not financial advice, and any breakout signal can fail; treat these as conditional scenarios, not guarantees.
Glossary
Symmetrical Triangle: A chart pattern where price highs trend lower and lows trend higher, converging toward a point where a breakout typically follows.
Rounded Bottom: A gradual, curved price structure that marks a slow shift from selling pressure to accumulation before a new uptrend.
Descending Channel: A price structure where both highs and lows trend lower inside two roughly parallel lines.
Ascending Channel: A price structure where both highs and lows trend higher inside two roughly parallel lines.
RSI (Relative Strength Index): An oscillator ranging from 0 to 100 that measures the speed and size of recent price moves. It is often used to flag overbought or oversold conditions.
Liquidation: The forced closing of a leveraged position when losses erode a trader's margin below the required maintenance level.
Total Value Locked (TVL): The total value of assets deposited or staked within a protocol at a given time.
Methodology
Price levels and chart patterns referenced in this Pump.Fun price predictions are drawn from the PUMP/USDT daily chart on Binance, using the most recent completed daily candle close. Liquidation and exchange volume figures are sourced from Coinglass.
All levels reflect data at the time of writing and are subject to change as new candles form.
This PUMP price forecast does not extend any target beyond what the visible chart structure directly supports.
Disclaimer: This Pump.fun Price Prediction is for informational purposes only and does not constitute financial, investment, or trading advice. PUMP and cryptocurrency markets broadly are highly volatile, and any chart pattern discussed here, including the symmetrical triangle, can fail to play out as expected. Downside risk in the bear scenario could extend beyond the stated support levels if broader market conditions turn negative. Always do your own research and consult a qualified financial advisor before making investment decisions.
Also read:
















