PUMP Surges 20%: Pump.Fun Price Prediction Signals a Bigger Rally


Pump.fun launched as a Solana-based token launchpad that let anyone create and trade meme coins with just a few clicks, quickly becoming one of the most active platforms in the meme coin space.
Its native token PUMP followed after the platform had already built a large user base, tying token value to the ecosystem's ongoing activity.
$PUMP is trading around $0.003863, up 17.2% in the past 24 hours.
Live Market Data
Here's the live snapshot behind this pump.fun price prediction as of writing.
Metric | Value |
Price | $0.003863 |
24h Change | +17.2% |
Market Cap | $1.507B |
Fully Diluted Valuation | $3.237B |
24h Trading Volume | $313.085M |
Total Value Locked | $301.373M |
Circulating Supply | 390.462B |
Total Supply | 838.724B |
Max Supply | 1T |
Source: $PUMP market cap data taken from Coingecko, data as of Aug 21, 2026. Figures may vary slightly across other tracking websites.
Liquidation Snapshot
Pump.fun's derivatives market has been highly active through this breakout.
Over the past 24 hours, $6.20M in positions got liquidated, with shorts taking by far the bigger hit at $5.57M against $629.92K on longs, a sign a lot of short sellers got caught leaning against a strong move. 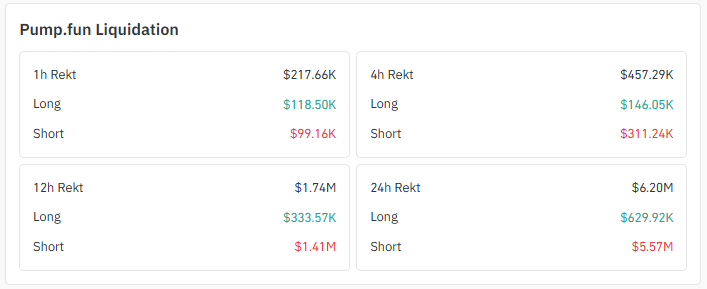
Source: Liquidation Data Taken From Coinglass.
That same pattern shows up across shorter windows too: $1.41M in short liquidations over 12 hours against $333.57K on longs and $311.24K in short liquidations over 4 hours against $146.05K on longs.
Exchange Volume
Exchange | 24h Volume |
Binance | $370.25M |
OKX | $308.32M |
Hyperliquid | $146.56M |
Bitget | $48.16M |
Gate | $18.65M |
BingX | $17.25M |
KuCoin | $13.97M |
Coinbase | $13.86M |
Source: Volume Heatmap Data Taken From Coinglass.
Social Sentiment of $PUMP
Social sentiment around $PUMP has picked up sharply alongside this breakout.
Ecosystem-focused accounts have highlighted the token's roughly 21% single-day gain. 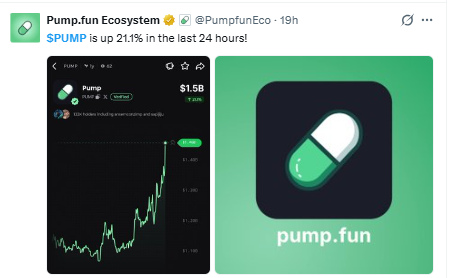
Source: Data Taken From @PumpfunEco, X Account.
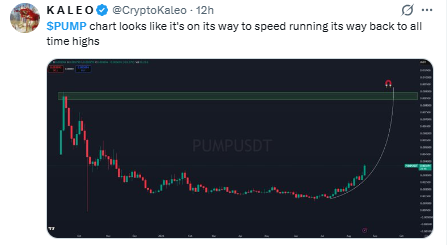
Source: Data Taken From @Cryptokaleo, X Account.
While other market commentators describe the current chart structure as resembling a fast, parabolic run with the potential to retest prior all-time highs.
Why it matters for PUMP: strong social momentum right after a confirmed technical breakout tends to reinforce the move in the short term, since it can pull in fresh buying interest on top of the chart setup itself. Even so, this pump.fun price prediction treats the parabolic comparison as sentiment rather than a guaranteed outcome.
Key Takeaways
PUMP cleared the neckline of a rounded bottom structure on the daily chart, then broke the upper boundary of a fresh ascending channel, and this pump.fun price prediction leans bullish off both breakouts.
Price is trading near $0.003913, up over 17% over the past 24 hours.
Hold momentum, and the next stop is $0.004505, then $0.005214, with $0.005989 as the bigger target.
A rejection from the upper side could send the price back toward the $0.002800 support zone instead.
Social chatter is comparing the current chart structure to a parabolic run back toward all-time highs.
24-hour liquidations hit $6.20M, and shorts took the far bigger hit here at $5.57M.
Technical Analysis: Daily Chart Analysis of $PUMP
On the daily chart, PUMP spent a long stretch carving out a rounded bottom structure, the kind of slow-curving base that often forms after a prolonged decline finally runs out of sellers.
Price eventually cleared the neckline of that structure, confirming the base was done and buyers had taken control.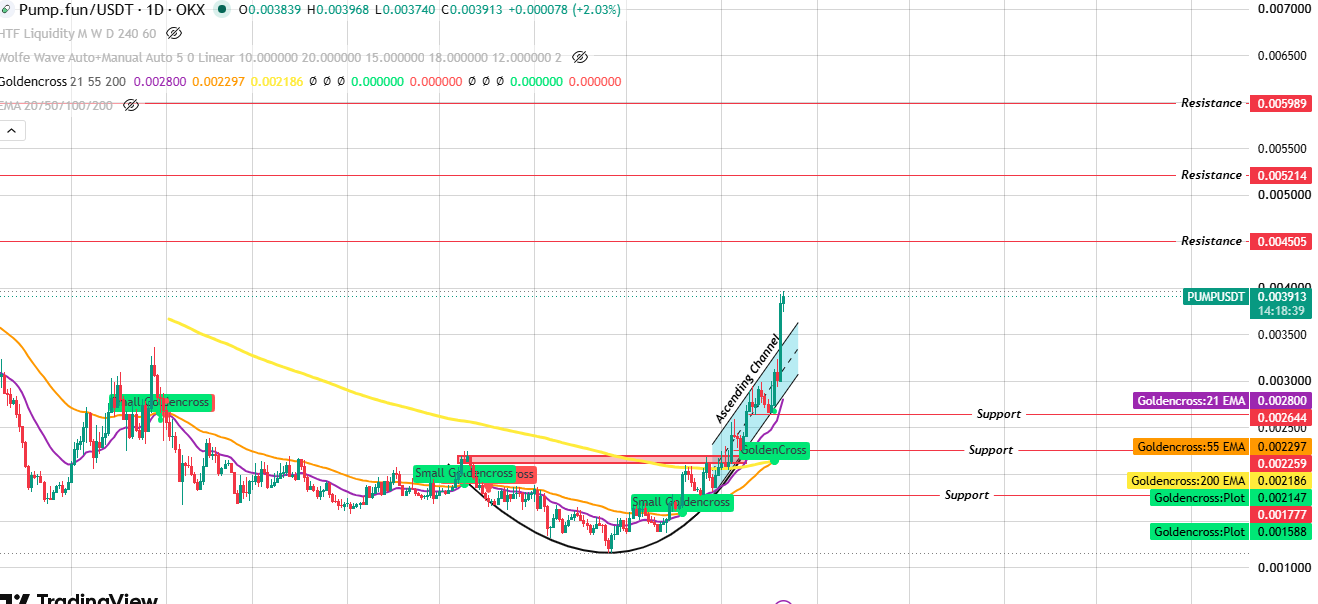
Source: Chart Taken From TradingView.
From there, price built a fresh ascending channel, climbing in a controlled stair-step pattern between rising support and resistance lines.
That channel's upper boundary has now been broken, and the price is pushing into new territory as a result.
If momentum holds from here, this pump.fun price prediction points toward $0.004505 first, then $0.005214, with $0.005989 as the bigger target further out.
If the price instead gets rejected from the upper side, expect a pullback toward the $0.002644 support zone, where the golden cross EMA cluster sits.
Support and Resistance Levels
Chart-derived levels are shaping this pump.fun price prediction right now.
Type | Level |
Resistance | 0.005989 |
Resistance | 0.005214 |
Resistance | 0.004505 |
Current Price | 0.003913 |
Support | 0.002644 |
Support | 0.002259 |
Support | 0.001777 |
EMA Levels
EMA | Value | Price Position |
21 EMA | 0.002800 | Price trading above |
55 EMA | 0.002297 | Price trading above |
200 EMA | 0.002186 | Price trading above |
Bull, Base, Bear Case
This pump.fun price prediction breaks into three scenarios depending on how the price handles the resistance zone above the recent channel breakout.
Case | Level | Setup | Invalidation |
Bull | 0.005989 | Channel breakout holds, and momentum carries price through both nearer resistance levels. | Daily close back below 0.002800 |
Base | 0.004505 | First resistance right above the current price, a natural pause after the channel breakout | Loss of the 0.003500 area on a daily close |
Bear | 0.002800 | Rejection at resistance breaks the channel structure; the price falls back to the golden cross support zone. | Daily close under 0.001777 |
Glossary
Rounded Bottom: A slow, curving price base that often forms after a decline finally exhausts sellers, frequently followed by a reversal higher.
Neckline Breakout: The moment the price clears the resistance line marking the top of a base structure, confirming the pattern.
Ascending Channel: A rising price structure bound by two parallel trendlines, one connecting the highs and one connecting the lows.
Golden Cross: A bullish signal that occurs when a shorter-term moving average crosses above a longer-term one.
Liquidation: The forced closing of a leveraged position once losses eat through a trader's available margin.
Methodology
This pump.fun price prediction draws on multi-source data, including daily timeframe chart structure, EMA positioning, live liquidation figures, exchange volume distribution, and current market sentiment.
Price levels referenced here come directly from chart structure rather than extrapolation. Markets move fast, so treat these levels as a framework rather than a fixed outcome.
Disclaimer: This article is for informational purposes only and does not constitute financial advice. Cryptocurrency markets, including Pump. fun, are highly volatile, and carry significant risk. Always do your own research and consult a licensed financial advisor before making investment decisions.
Also read:










.webp)






