Pyth Network Price Prediction September 2026: PYTH Outlook


The Pyth Network just broke out and traders are chasing it fast.
Volume has more than doubled in 24 hours, a classic sign of building momentum. Pyth is one of crypto's biggest oracle networks, feeding real-time price data to hundreds of DeFi apps, and this breakout has everyone asking if it's finally PYTH's moment.
This Pyth Network Price Prediction September 2026 breaks down where PYTH could head next.
Pyth Network Price Prediction September 2026: Market Overview
Metric | Value |
Price | $0.05094 |
24h Change | -0.9% |
Market Cap | $400.62M |
Unlocked Market Cap | $400.62M |
FDV | $508.73M |
24h Volume | $407M |
Vol/Mkt Cap (24h) | 104.88% |
Liq/Mkt Cap | 0.12% |
Total Supply | 9.99B PYTH |
Max Supply | 10B PYTH |
Circulating Supply | 7.87B PYTH |
Holders | 304.4K |
Source: Data from CoinMarketCap as of August 25, 2026, at 1:44 IST. Figures may vary slightly across other tracking websites.
$Pyth Network Price Prediction: Liquidation & Volume
$PYTH's futures liquidation data from Coinglass shows relatively light activity over short windows but a clear long-side bias building over the past day. 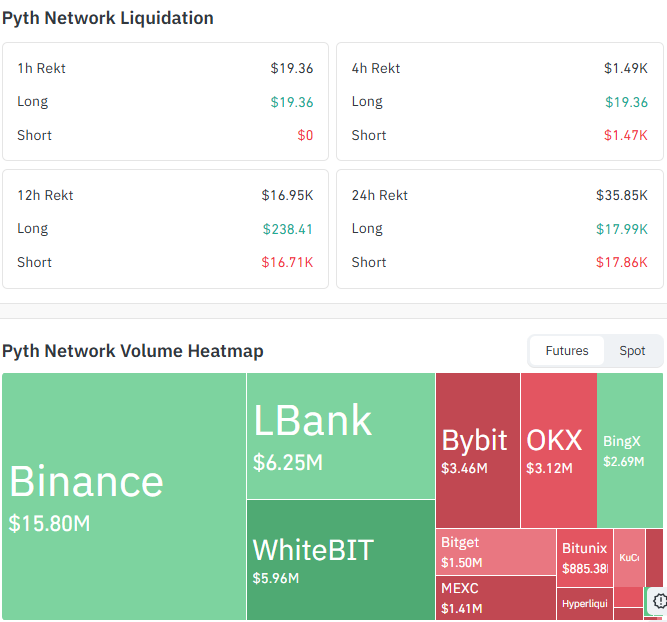
Source: Data From Coinglass
In the last hour, $19.36K in longs were liquidated against none on the short side.
Over 4 hours, longs accounted for $19.36K in liquidations versus $1.47K in shorts.
Over the 12-hour window, long liquidations reached $238.41 against a much larger $16.71K in shorts, and over the full 24 hours, longs totaled $17.99K in liquidations against $17.86K in shorts, a fairly even split.
On the exchange side, Binance leads futures volume at $15.80M, followed by LBank at $6.25M and WhiteBIT at $5.96M.
Bybit and OKX follow at $3.46M and $3.12M respectively, with BingX, Bitget, Bitunix, and MEXC rounding out smaller shares.
This is futures volume from Coinglass and separate from the spot volume figure in the market overview above.
PYTH Price Prediction Chart: Technical Analysis
Pair: Pyth Network/USDT · Market: Spot · Exchange: OKX · Timeframe: 1D · Timestamp: August 25, 2026, 12:43 UTC+5:30
Pyth Network is trading at $0.05094, the price is stuck in a large symmetrical triangle that has been compressing since July.
Price is trading near key support zones. If it breaks above the triangle pattern, the higher levels will be the next ones to watch.
RSI is reading 68.52, approaching overbought territory and reflecting the strength of this breakout push.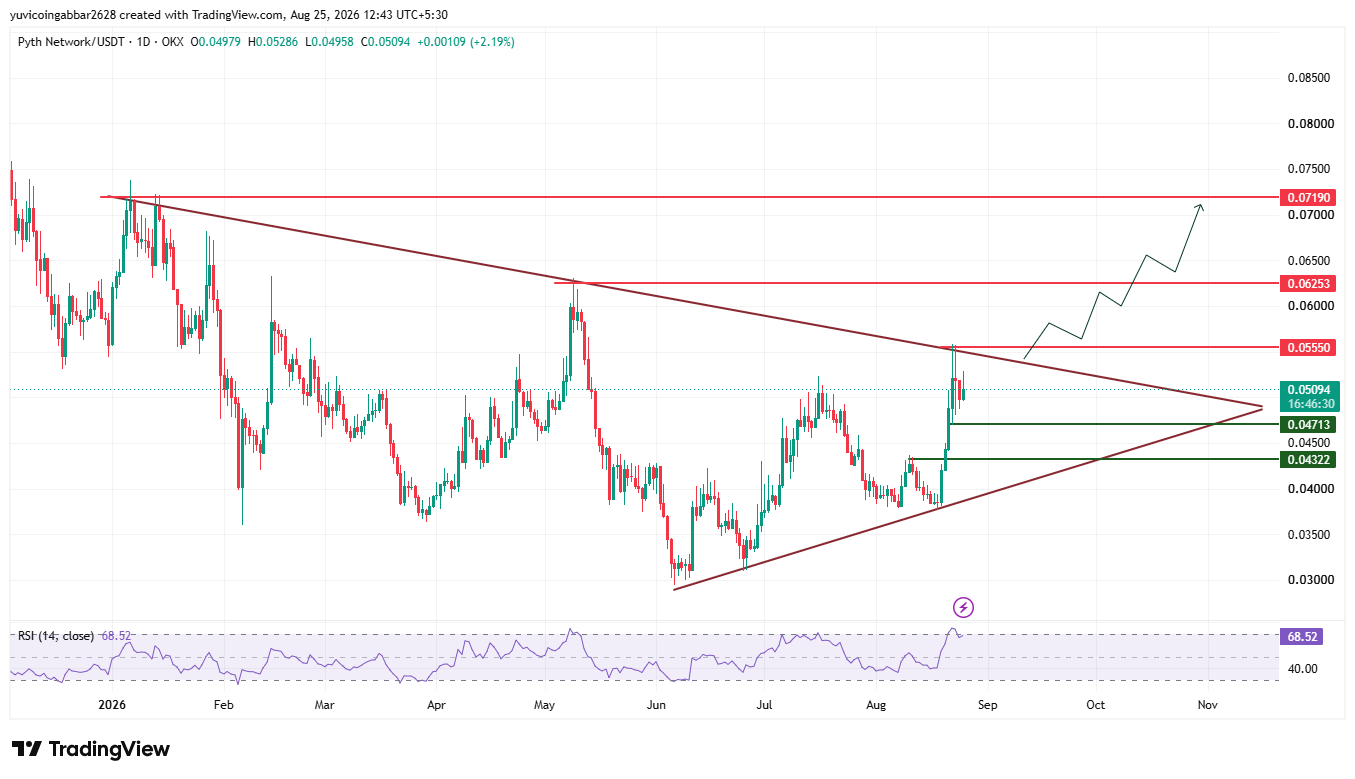
Pyth Network Price Prediction September 2026: Key Levels
Level Type | Price |
Resistance 3 | $0.07190 |
Resistance 2 | $0.06253 |
Resistance 1 (nearest) | $0.05550 |
Immediate Price Reference | $0.05094 |
First Confirmed Support | $0.04713 |
Deeper Support | $0.04322 |
$Pyth Network Forecast: Bull Case vs Bear Case
$PYTH price target 2026 Bull case: Holding above $0.04713 keeps the triangle structure intact.
A confirmed daily close above $0.05550 would open the path toward $0.06253, and sustained volume alongside the current RSI momentum could support a push toward $0.07190.
$PYTH price target 2026 Bear case: A rejection at $0.05550 combined with the approaching overbought RSI raises the odds of a pullback into the triangle.
Losing $0.04713 would put the breakout in question, and a deeper break below $0.04322 would undo most of this week's gains.
Price Scenarios: Triggers and Invalidation
Scenario | Trigger | Likely Outcome | Invalidation Point |
Triangle breakout / bullish | Close above $0.05550 | Move toward $0.06253 | Close back below $0.04713 |
Range hold | Price stays between $0.04713 and $0.05550 | Sideways consolidation | Break of either boundary |
Pullback | Rejection at $0.05550 | Retest of $0.04713 | Reclaim above $0.05550 |
Channel breakdown / bearish | Close below $0.04322 | Slide back into the triangle range | Reclaim above $0.04713 |
How High Can $Pyth Network Go This Year?
$0.07190 is the highest resistance marked on the current chart.
Reaching it would require $PYTH to first clear $0.05550, then hold above $0.06253 on strong volume, a multi-stage move rather than a single breakout candle.
Pyth Network Price Prediction September 2026: Expert View
According to CoinGabbar analysts, the sharp jump in 24-hour volume points to real conviction behind this move, and the roughly even split between long and short liquidations over 24 hours suggests the rally isn't purely a short squeeze.
$0.04713 is the level that determines a healthy retest, so how $PYTH holds that zone into early September matters more than the current price swing.
If volume stays elevated, a push toward $0.05550 looks like the more likely near-term path.
Disclaimer: This piece is for informational purposes only and isn't financial advice. The levels and scenarios above are based on technical chart analysis and publicly available data at the time of writing, and crypto markets can move sharply within hours, so past patterns don't guarantee future outcomes. It's worth doing independent research and considering your own risk tolerance before acting on any of the levels discussed here.
Also read:

















