Pyth Network Price Prediction August 2026: PYTH Breakout Watch


Pyth Network (PYTH) is approaching a critical breakout zone in August 2026 as the token trades near $0.0398 inside a daily descending channel and weekly falling wedge. The move comes as $PYTH expands its real-time market data coverage with new Asian equity feeds, giving traders two factors to watch: technical reversal signals and ecosystem growth.
Why $PYTH Is Sitting At A Make-Or-Break Level
This Pyth Network price prediction August 2026 matters because $PYTH trades near $0.0398, down 1.16% over the past day, per CoinMarketCap data.
It's squeezed inside a daily descending channel and a much larger weekly falling wedge at the same time. Basically, both patterns are running out of room.
Neither RSI reading looks stretched, though. Daily RSI sits at 39.61 and weekly at 42.43, both leaning soft but not oversold.
So this isn't a story about an overheated coin cooling off. It's a coin sitting at a decision point, and this $PYTH Network price prediction August 2026 leans on exactly that setup. For the wider market backdrop, our crypto price prediction hub tracks similar squeezes across majors.
Why $PYTH Is Moving Today
There's no single dramatic headline driving $PYTH lower today. But the project itself has been busy.
Pyth Network's own account confirmed Asian equities are now live on Pyth Pro, covering South Korea, Japan, Hong Kong, and mainland China with over 100 feeds today and 450 more coming, per its official update.
That's infrastructure news, not a price-pump trigger. And it follows a separate rollout tracking $AAPL, $COIN, and $MSTR earnings continuously through Pyth Indices.
Here's the thing: liquidations stayed tiny. Over 24 hours, $PYTH saw just $3.61K wiped out, mostly longs, per Coinglass data. No short squeeze here.
For more on how the token first crossed into macro data territory, see our earlier PYTH price prediction piece on the US GDP integration.
What Does Pyth Network's Asian Equity Expansion Mean for $PYTH?
Real-world data feeds matter to Pyth Network's business model because they expand oracle usage across DeFi and institutional platforms that pay to consume this data.
More feeds and more chains covered generally strengthen the network's case as core infrastructure.But oracle demand and token demand aren't the same thing.
$PYTH accrues value through staking, governance, and fee mechanisms tied to network usage, not through a direct 1:1 link between feed adoption and price.
Growth in feeds is a fundamental tailwind, not a guaranteed price catalyst.So while the Asian equities rollout strengthens Pyth's long-term positioning, it's reasonable to treat it as a background factor for this Pyth Network price prediction rather than a reason to expect an immediate price reaction.
$PYTH Technical Analysis: Daily Chart
On the daily chart, $PYTH closed near $0.0398, down 1.19% on the candle, riding the lower half of a descending channel that's held since May.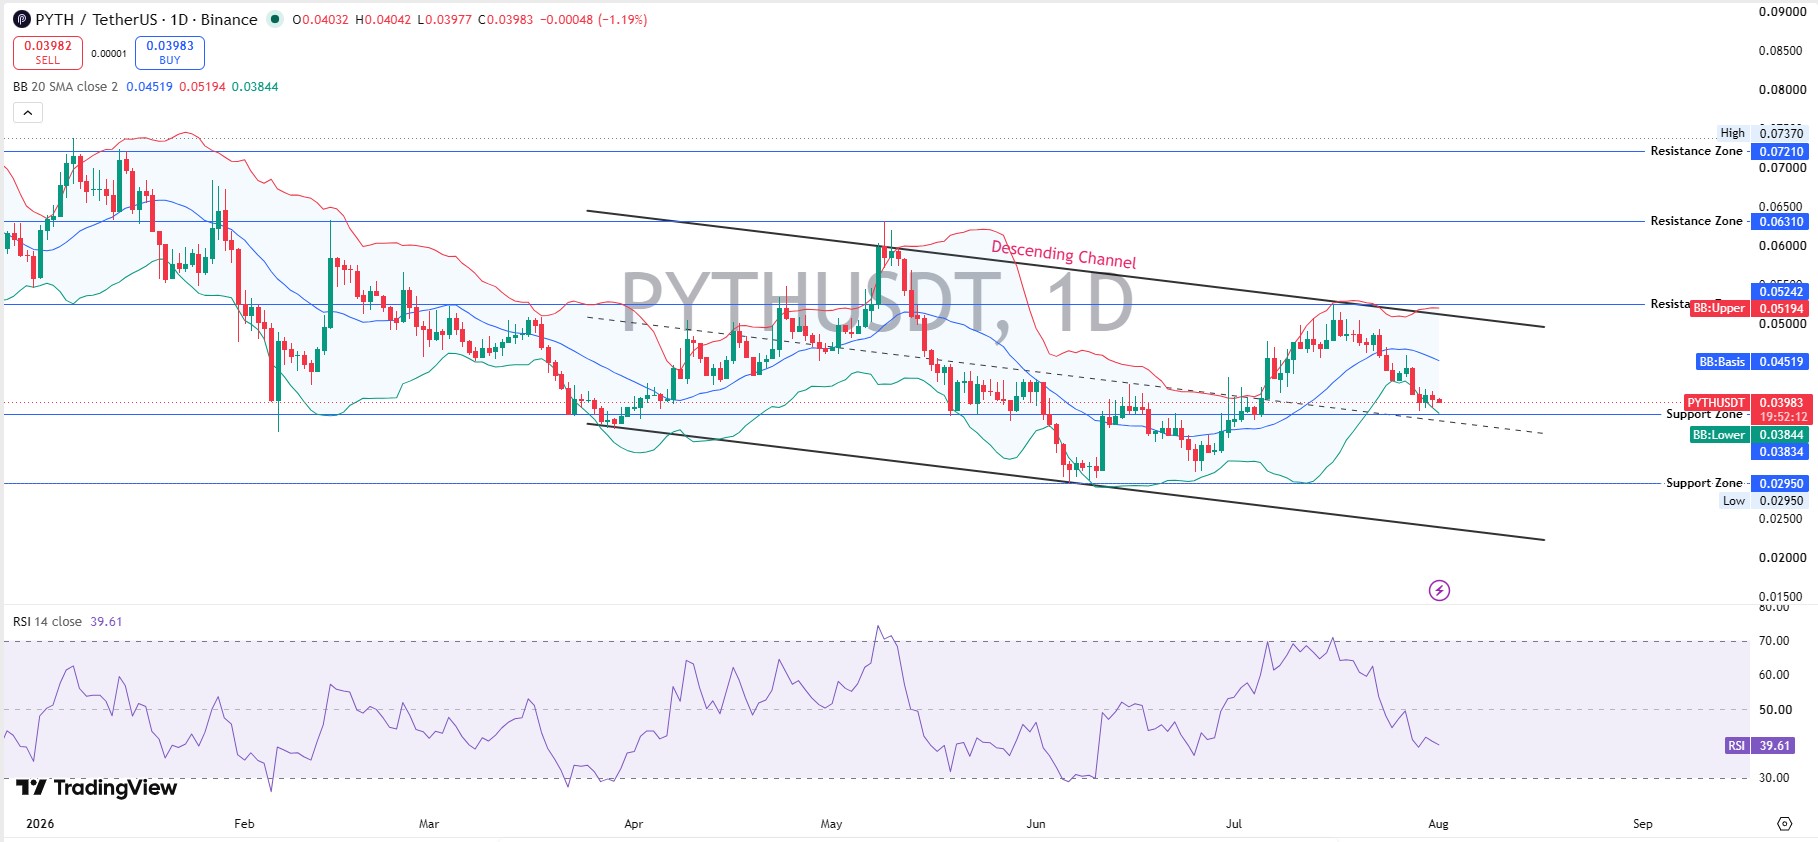
Price sits below the 20-period Bollinger basis at $0.0452, with the lower band at $0.0384, according to TradingView data.
Daily resistance stacks at $0.0524, then $0.0631, then a high near $0.0737. Support sits at $0.0384, then a deeper zone near $0.0295.
When we pulled up the daily RSI, the first thing that stood out was how flat it looked. Not oversold. Not overheated. Just stuck at 39.61. A daily close back above the channel's upper trendline. That would be the first real sign of a shift.
Technical Analysis: Weekly Chart
Zoom out, and the picture turns more interesting. $PYTH's weekly chart shows a falling wedge stretching back to the 2024 all-time high near $1.15, tightening toward the current price zone.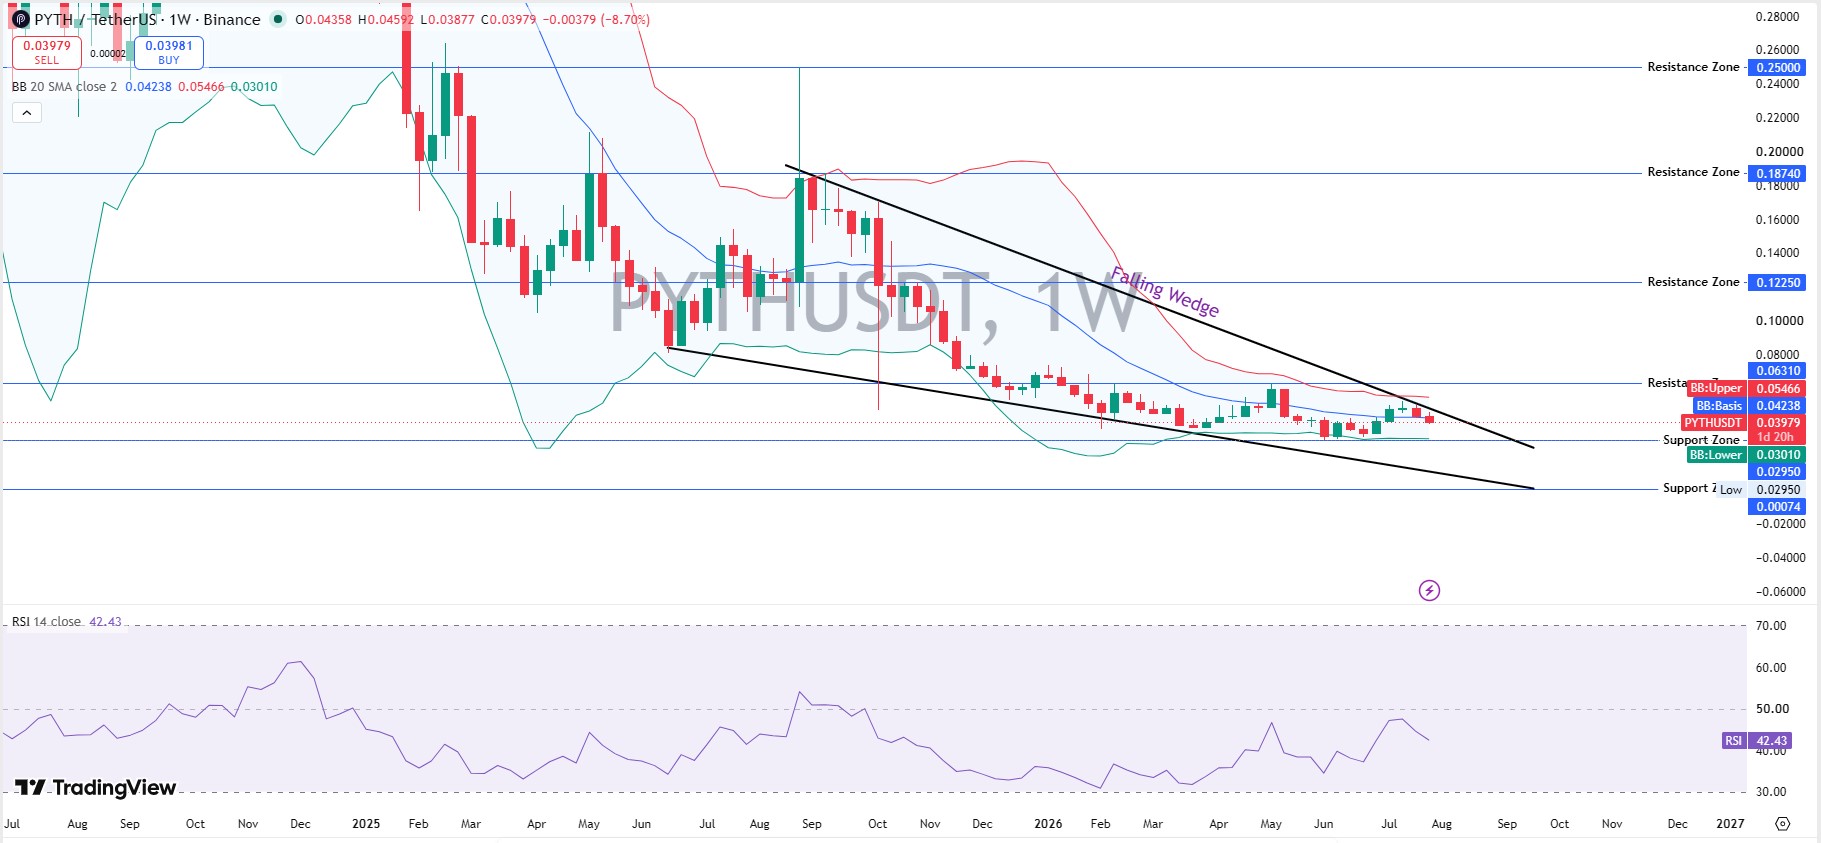
Weekly resistance sits far overhead at $0.1225, $0.1874, and $0.2500. Weekly support holds near $0.0301, close to the daily lower band.
Falling wedges are often viewed as potential bullish reversal patterns, but confirmation requires a breakout with volume support. For a similar multi-year setup, our bitcoin price prediction 2026 breakdown covers the same wedge logic.
$PYTH Support And Resistance Levels
Immediate support: $0.0384 (daily BB lower), then $0.0301, then $0.0295. Immediate resistance: $0.0452 (daily basis), then $0.0524, then $0.0631.
A daily close back above $0.0452 eases near-term pressure. A close under $0.0295 would break the channel and the wedge floor at once, and that's the real invalidation line for any bullish $PYTH Network price prediction right now. Our ethereum price prediction 2026 piece walks through a comparable wedge break for context.
Tokenomics And Whale Concentration
$PYTH's circulating supply sits near 7.87B tokens against a 10B max supply, giving a fully diluted value of $397.77M against a $313.24M market cap, per CoinMarketCap.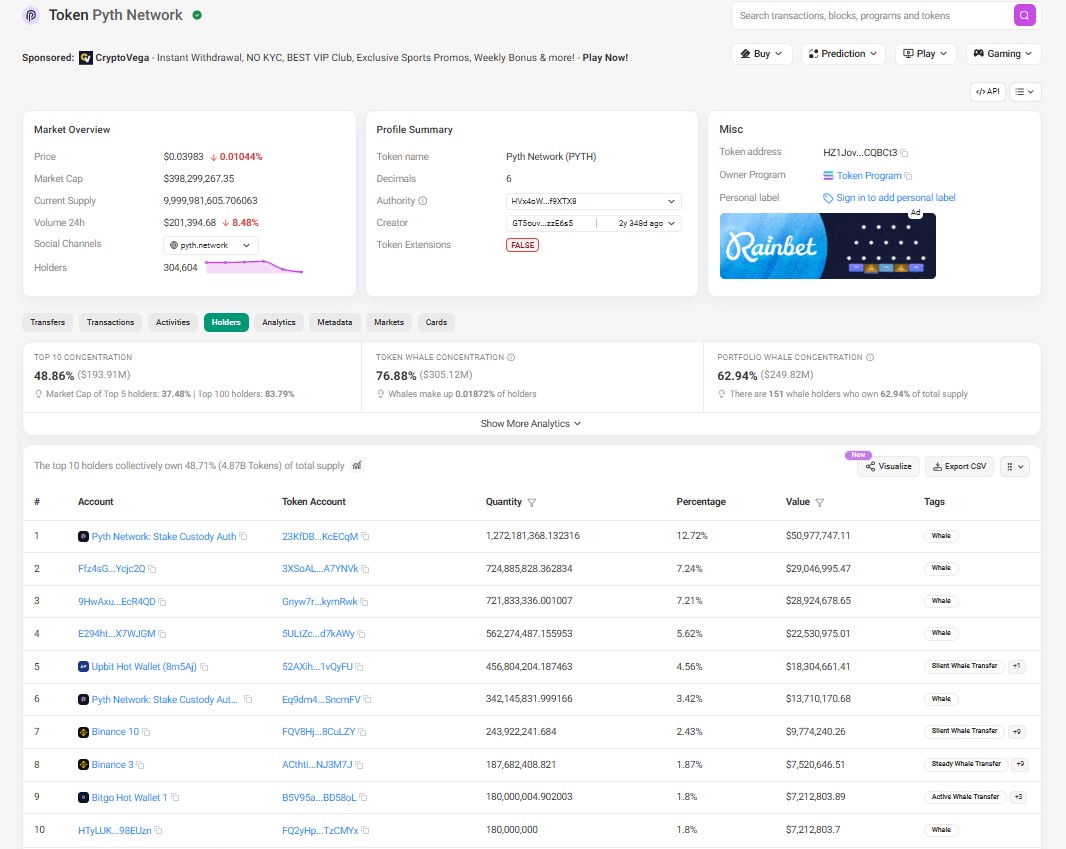
Concentration runs heavy. Top 10 wallets hold 48.86% of the supply, and 151 whale wallets, a sliver of total holders, control 62.94% of market cap, per Solscan holder data.
The largest wallet appears to be a $PYTH Network custody contract, which reduces the likelihood that the balance represents immediate exchange selling pressure. It holds 12.72% ($50.98M) in locked custody, not free-floating supply. Upbit's hot wallet ranks fifth at 4.56%.
Anyone tracking similar vesting schedules elsewhere can check our token unlock calendar for other assets.
Where $PYTH Is Actually Trading
WhiteBIT carries the largest share of $PYTH futures volume at $7.10M, followed by LBank near $4.36M and Binance around $4.06M, per Coinglass data.
That's a modest derivatives footprint against $PYTH's market cap. Fresh pairs and listings are worth tracking on our exchange listing page.
$PYTH Price Prediction: Scenarios By Timeframe
Timeframe | Bull Case | Base Case | Bear Case |
24H | Reclaims $0.0452, tests $0.0524 (moderate) | Chops between $0.038-$0.045 (high) | Slips under $0.0384 toward $0.0301 (low) |
7D | A daily close above $0.0524 opens $0.0631 (low-moderate) | Range-bound inside the channel (high) | Weekly close under $0.0301 confirms breakdown (moderate) |
Aug 2026 | Wedge resolves up, targets $0.0631-$0.0737 (low-moderate) | Drifts $0.035-$0.045 tracking feed rollout news (moderate) | Breaks $0.0295, retests the all-time low near $0.0296 (low) |
Invalidation for the bullish case is a daily close under $0.0384. A weekly close under $0.0301 would be the deeper warning sign.
$PYTH Market Outlook: Risks To Watch
Whale concentration tops the list, even accounting for the custody-contract nuance. Owning 62.94% of market cap across 151 wallets is still a thin float.
And two converging patterns also mean volatility is likely coming, in either direction. The Asian equities rollout, genuinely useful for the network, isn't the kind of catalyst that moves price on its own.
This Pyth Network price prediction August 2026 leans neutral-to-cautious in the near term, turning constructive only on a confirmed close above resistance. For traders tracking $PYTH latest news and broader $PYTH price forecast trends, the PYTH support resistance zones outlined above remain the key technical reference points, alongside this Pyth Network news August 2026 rollout. Broader sentiment shifts across the sector are worth watching too, something our crypto airdrops tracker keeps an eye on.
Methodology
Chart levels came from PYTH/USDT daily and weekly charts on Binance via TradingView, using RSI-14 and 20-period Bollinger Bands, captured on August 1, 2026, around 06:00 UTC. Price, supply, and market-cap data came from CoinMarketCap. Holder concentration came from on-chain token-holder analytics on Solscan. Liquidation and futures-volume data came from Coinglass. Feed-expansion updates came from Pyth Network's official account on X, cross-checked against broader crypto coverage.
Disclaimer: This is speculative market commentary, not financial or investment advice. Crypto assets are volatile and can lose most or all of their value. Data is current as of August 1, 2026; verify live figures before trading.













.jpg)




