QuarkChain Price Prediction 2026–2030: How High Can $QKC Go?

This QuarkChain price prediction starts with the number that matters most. QKC is trading near $0.0032 as of 13:20 UTC on September 8, 2026, according to current market data, up over 40% in a day. That's not a typo.
The current trend is sharply bullish on the daily chart. But the RSI is flashing a warning most traders can't ignore.
The biggest catalyst right now? A breakout from a multi-month ascending channel, paired with a weekly falling wedge breakout too.
Key support sits near $0.002073, with a deeper floor at $0.001782. Resistance stacks up fast above $0.003608.
Near term, the setup favors more upside. But it's stretched, and stretched moves snap back.
Quick QKC Prediction Snapshot
Metric | Current View |
Current Price | $0.0032 |
Trend | Bullish (short term), recovering (long term) |
Next Target | $0.003608–$0.004740 |
Support | $0.002073 / $0.001782 |
Resistance | $0.003608 / $0.004740 |
RSI (Daily) | 85.79 (Overbought) |
Bull Case | $0.0084+ |
Base Case | $0.0032–$0.0047 |
Bear Case | $0.0018–$0.0021 |
Invalidation | Below $0.001782 |
Why Is QuarkChain Price Moving Today?
QKC price today jumped over 40% on massive volume. Something clearly shifted.
QKC Volume and Momentum Signal
Daily trading volume hit roughly 825 million QKC, a sharp spike from prior sessions. And that's the part that matters most here.
A price jump without volume is noise. This one isn't.
We pulled up the chart, and the breakout candle stood out instantly against weeks of quiet, sideways trading inside the channel.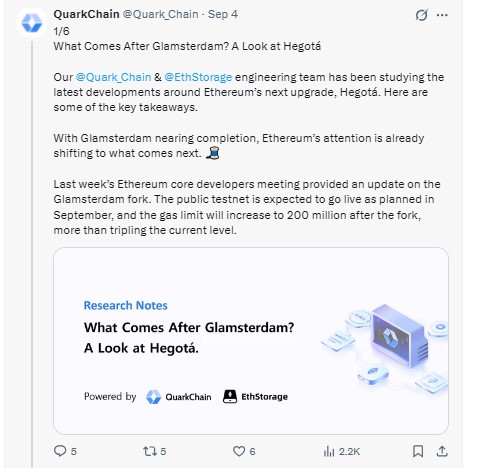
QuarkChain's own team has also been active lately, publishing recent research notes on Ethereum's next upgrade around the same time.
Binance Monitoring Tag Risk
Binance's Monitoring Tag system flags assets facing added scrutiny and possible delisting.
QKC has drawn attention under this framework in 2026. That's a real overhang.
Traders watching listing status should track exchange listing risks before sizing positions. Turns out, exchange status can move the price faster than any chart pattern.
QuarkChain Technical Analysis and Current Trend
QKC technical analysis right now shows a coin-breaking structure after a long grind lower.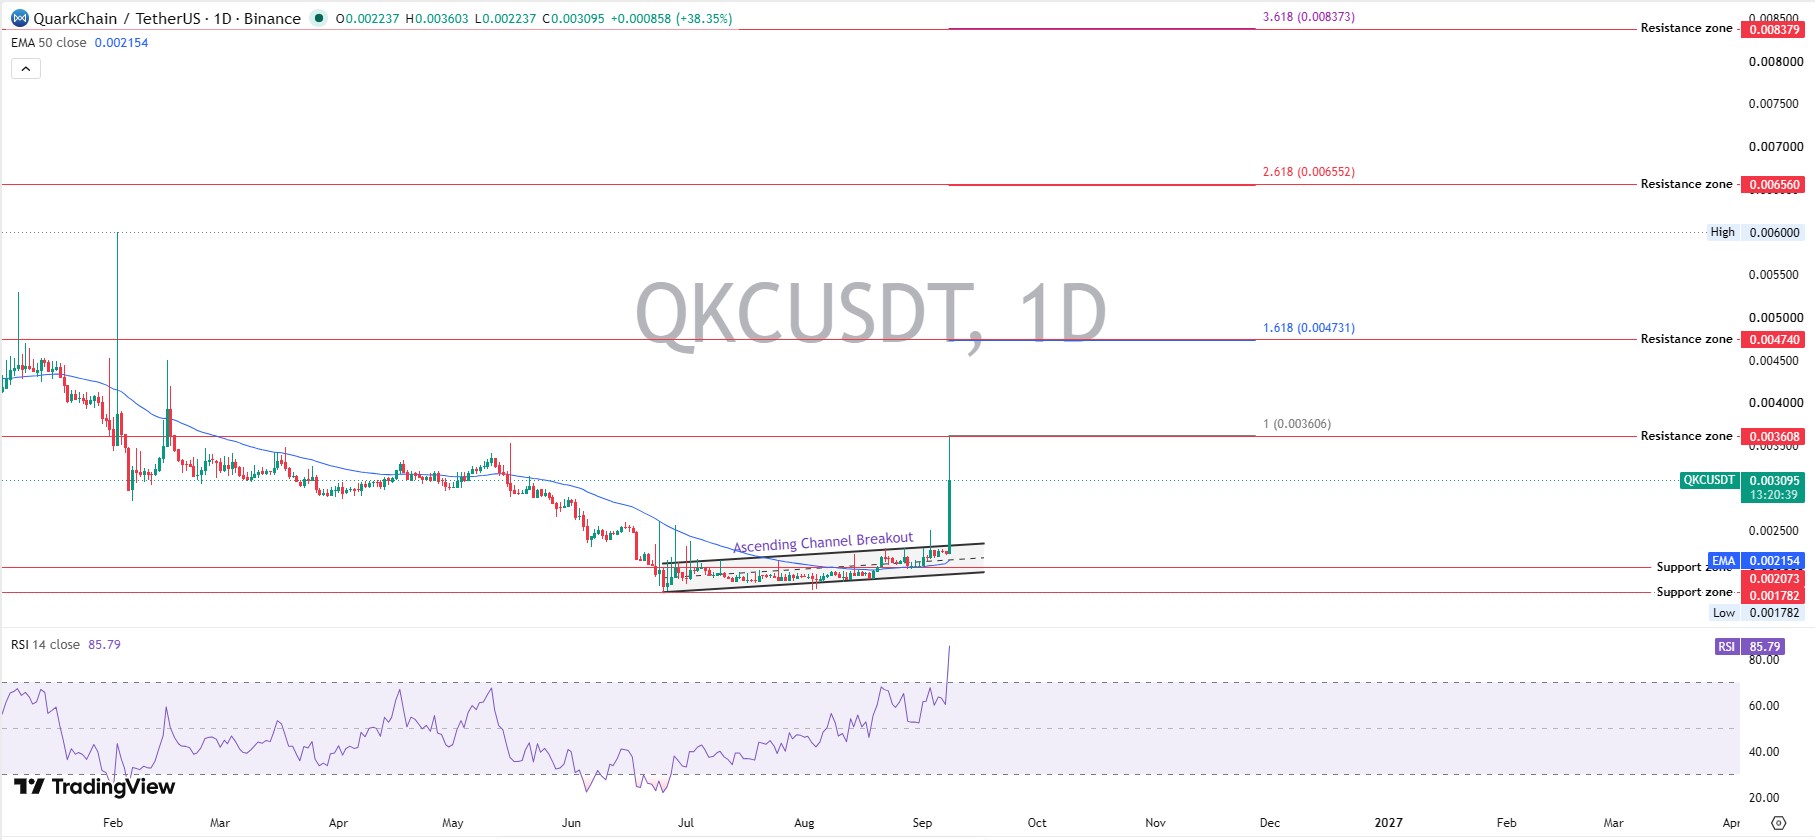
QKC Support Levels
Immediate support sits at $0.002073. Below that, $0.001782 is the line that matters.
A trade under $0.001782 would break the recent structure entirely.
QKC Resistance Levels
The first resistance is $0.003608. Above it, $0.004740 and then $0.006560 stack up as Fibonacci extension zones.
RSI and MACD Signals
Daily RSI reads 85.79. That's deeply overbought.
Weekly RSI sits at 60.79, far calmer, and still has room to run.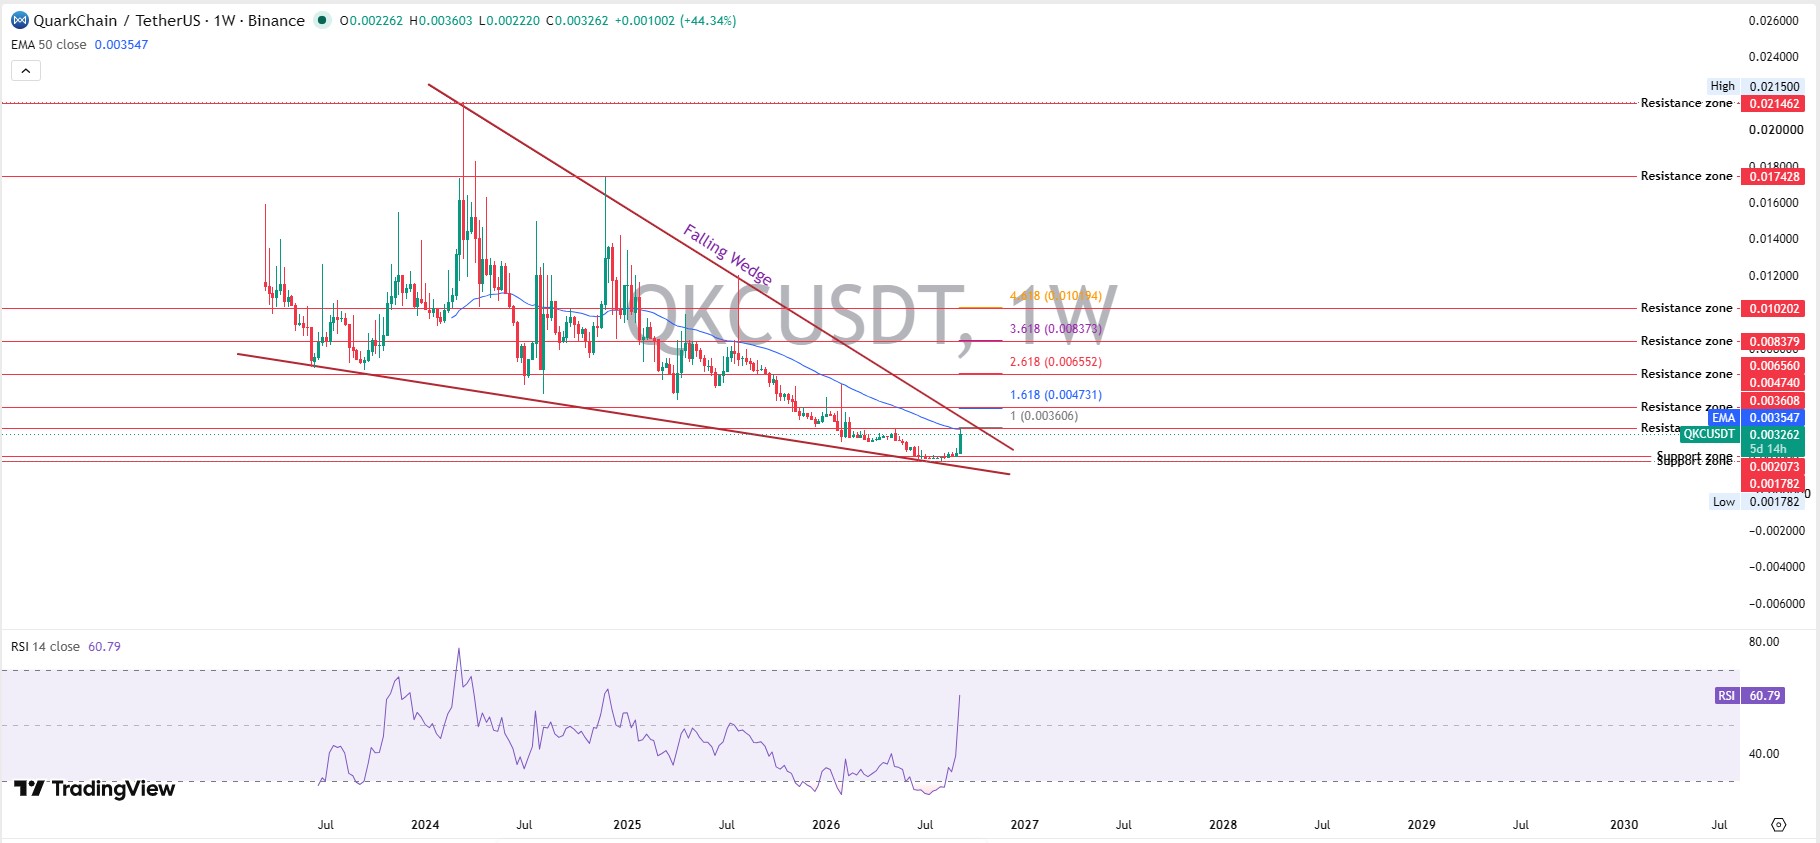
Daily MACD is positive at 0.000127, with the histogram confirming momentum. Weekly MACD is still negative, though the histogram just turned green.
So short-term momentum is strong. Long-term momentum is only just recovering. Actually, "recovering" undersells it, it's the first real weekly reversal signal in months.
Breakout and Breakdown Levels
A close above $0.003608 on strong volume opens the door toward $0.004740. And a fade back under $0.002073 would flip the setup bearish fast.
QuarkChain Price Prediction for the Next 7 Days
QKC price prediction for the next 7 days likely falls between $0.0026 and $0.0042.
RSI, this hot, usually cools first. But strong breakouts sometimes keep pushing before they pull back.
For how this compares to other altcoins right now, check other crypto price predictions.
QuarkChain Price Prediction for 30 Days
QuarkChain's 30-day price prediction points to a range of $0.0025 to $0.0055.
Bullish trigger: a clean trade above $0.004740 with rising volume.
Base range: consolidation between $0.0027 and $0.0038.
Bearish trigger: a drop under $0.002073.
Invalidation: any close below $0.001782.
Watch upcoming crypto events for anything that could shift this window.
QuarkChain Price Prediction 2026–2030
Year | Bear Case | Base Case | Bull Case | Key Driver |
2026 | $0.0018 | $0.0042 | $0.0084 | Trend + liquidity |
2027 | $0.0015 | $0.0065 | $0.0135 | Adoption + market cycle |
2028 | $0.0020 | $0.0090 | $0.0180 | Ecosystem growth |
2029 | $0.0018 | $0.0110 | $0.0215 | Market-cycle conditions |
2030 | $0.0016 | $0.0140 | $0.0280 | Long-term adoption |
These figures come from the September 8, 2026, data. Markets change. Numbers will too.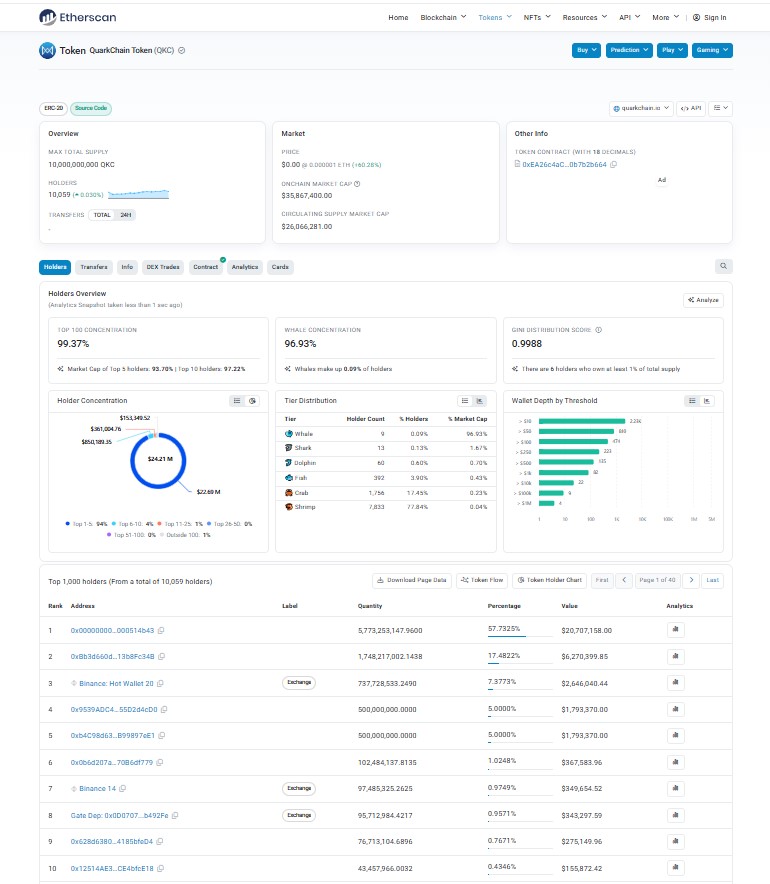
Supply data behind these numbers can be checked directly through token contract details on-chain.
Bull, Base, and Bear Scenarios for QKC
Bull Case
Needs a resistance breakout, rising volume, a stronger altcoin market, ecosystem growth, and reduced exchange risk. Target zone: $0.0047 to $0.0084, roughly 47% to 163% above today's price.
Renewed community activity around airdrop programs could add fuel here too.
Base Case
Range trading continues. Moderate growth, no major catalyst, resistance holds near $0.0047. Target zone: $0.0028 to $0.0038, roughly a 12% to 19% move from current levels.
Bear Case
Support breaks. Volume dries up. Bitcoin weakens. Exchange concerns deepen. And sentiment turns negative fast. Target zone: $0.0018 to $0.0021, a drop of about 34% to 44%.
What Could Drive QuarkChain Higher?
QuarkChain's future upside depends on real ecosystem work, not hype alone.
Layer-2 relevance, an AI narrative tailwind (see AI crypto updates), broader exchange access, and a stronger altcoin cycle all help.
Continued technical activity from the team, plus renewed community interest, both feed into this story too.
What Could Push QKC Lower?
The Monitoring Tag risk tops this list. Weak liquidity is close behind.
Bitcoin weakness, a support breakdown, thin development activity, tougher competition, and market-wide risk-off sentiment round out the threats.
Sentiment across the wider market, including broader crypto news, tends to drag smaller-cap coins like QKC along with it.
Can QuarkChain Reach $0.01?
Yes, mathematically, but it needs real weight behind it.
Numbers over hype. Market cap equals token price times circulating supply.
Market cap = token price × circulating supply.
With roughly 7.27 billion QKC circulating, hitting $0.01 requires:
0.01 × 7,270,000,000 = $72,700,000 market cap.
That's over three times today's roughly $23 million cap. Not impossible. But it needs sustained volume, not one green day.
Disclaimer
This article is for informational purposes only and isn't financial advice. Crypto markets are volatile, and QKC carries added exchange-related risk right now. Always do your own research, verify data independently, and never invest more than you can afford to lose.
Also read:

















