Shiba Inu Price Prediction Alert: Bulls Are Loading Don't Miss This


Shiba Inu (SHIB) is quietly building pressure inside a long-running descending channel, and last week's move higher grabbed attention across the market.
$SHIB is trading near $0.000005105, down about 4.39% over the past day even as the broader structure hints at a possible shift.
For anyone watching this Shiba Inu price prediction, the setup is simple: $SHIB has tapped the top of its weekly channel, and a clean break from here could open room for a bigger move.
Derivatives Pulse: Long Positioning Builds Up
According to CoinGlass data, SHIB's open interest sits at $58.10M as of August 29, 2026, holding well above the $20-30M range it traded in through most of June and July.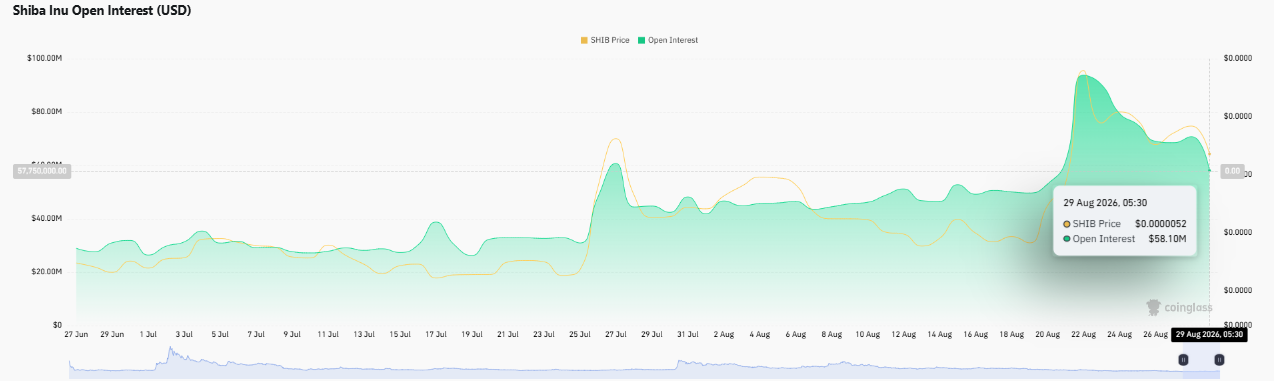
On OKX, the SHIB long/short ratio reads 2.42, showing traders leaning long. Liquidation data over the past 24 hours shows $121.18K wiped out, with longs taking the bigger hit at $118.91K against just $2.27K in short liquidations.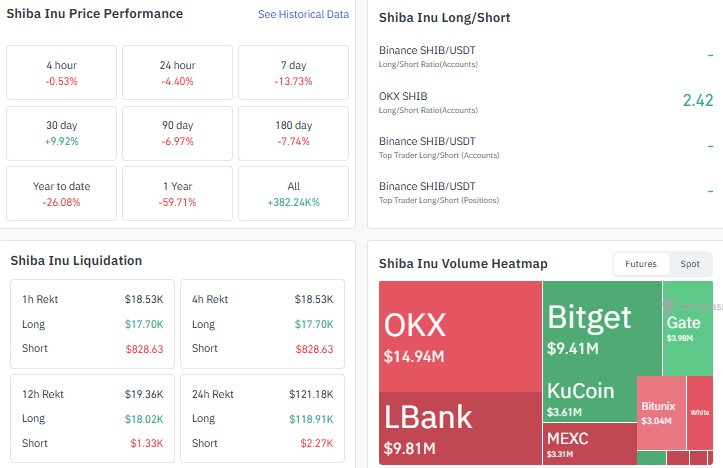
OKX and Bitget currently lead $SHIB futures volume at $14.94M and $9.41M, respectively.
On performance, $SHIB is up 9.92% over the past 30 days but remains down 13.73% for the week and 59.71% over the past year.
How Big Is the Market and Who Holds It?
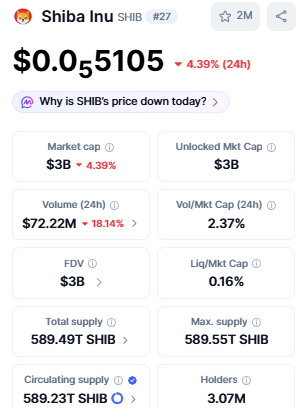
As per CoinMarketCap data, Shiba Inu carries a market cap of around $3B against a circulating supply of 589.23T $SHIB out of a 589.55T max supply, with 24-hour volume at $72.22M.
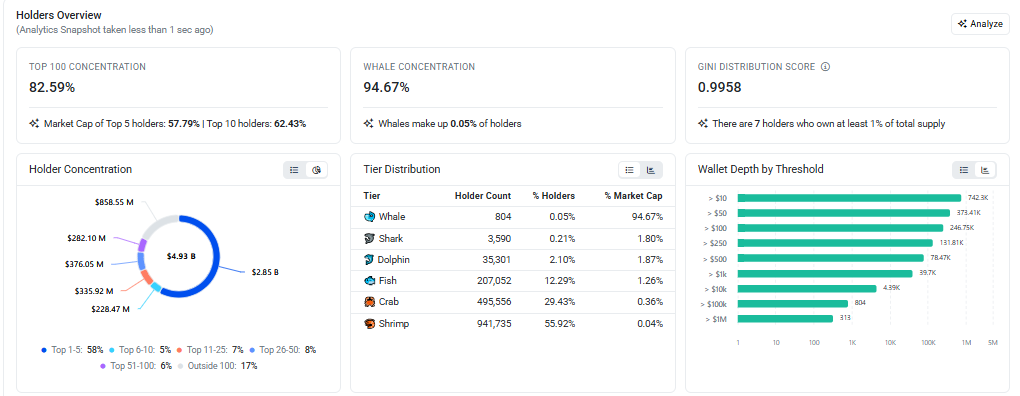
On-chain data shows over 1.68M holders on Ethereum, though the top 100 wallets still control more than 82% of supply, a concentration level worth watching for anyone tracking this Shiba Inu price prediction.
Bull, Bear, and Neutral Signals for SHIB
Signal | What It Shows |
Bullish | Weekly channel top tested, open interest climbing, long-heavy futures positioning |
Bearish | 7-day price down 13.73%; top 100 wallets hold over 82% of the supply. |
Neutral | RSI near 46, sitting in a balanced, non-extreme zone |
Technical Chart Read: SHIB's Weekly Structure
As per the TradingView chart, SHIB has been moving inside a descending channel on the weekly timeframe for well over a year, and price tested the upper boundary of that channel again last week.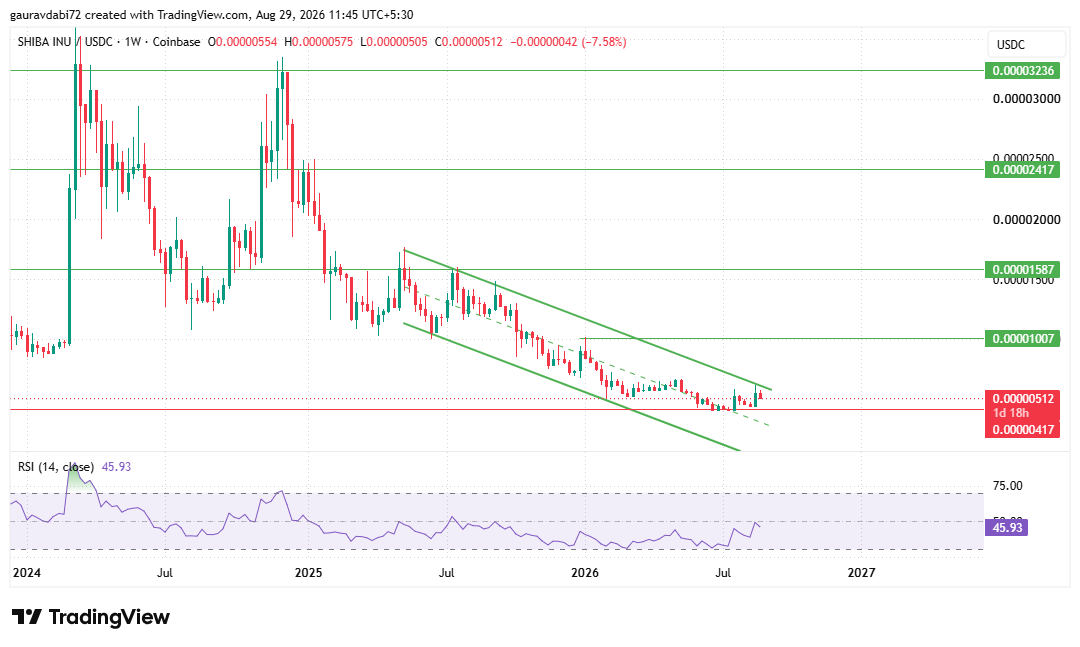
A confirmed break above this structure would put the next levels SHIB can go toward in view: 0.00001007, then 0.00002417, and further out, 0.00003236.
The weekly RSI (14) reads 45.93, sitting in fairly neutral territory, neither overbought nor oversold, which leaves room for a move in either direction.
If the channel holds instead, the nearest support to watch sits at 0.00000417.
Analyst Desk View
According to the CoinGabbar analyst desk, SHIB testing the top of a long-running descending channel alongside rising open interest is a combination worth tracking, though a single touch of resistance doesn't confirm a breakout on its own.
Traders following this Shiba Inu price prediction will likely watch whether SHIB can close above the channel on strong volume, since that's typically what separates a genuine trend shift from a temporary bounce.
Disclaimer: This article is for informational purposes only and should not be considered financial or investment advice. Cryptocurrency markets are highly volatile; readers are advised to do their own research before making any decisions.
Also read:

















