Shiba Inu Price Prediction September 2026: What's Next for $SHIB

Shiba Inu launched in 2020 as a meme token and has grown into one of the most widely held tokens in the market, backed by a large community and its own Shibarium network.
$SHIB currently trades at $0.000005335, down 5.3% on the day, with a market cap of $3.144B.
This Shiba Inu price prediction September 2026 update looks at where the coin could head next as traders watch how price behaves at current levels.
Price Today: Live Data and 24-Hour Change (SHIB)
Metric | Value |
Price | $0.000005335 |
24H Change | -5.3% |
24H Range | $0.00000521 - $0.00000574 |
Market Cap | $3.144B |
Fully Diluted Valuation | $3.145B |
24H Trading Volume | $108.909M |
Circulating Supply | 589.239T |
Total Supply | 589.496T |
Source: Market data taken from chart and market snapshots, data as of Aug 26, 2026 (UTC). Figures may vary slightly across other tracking websites.
Key Takeaways
SHIB trades at $0.000005335, down 5.3% on the day, after pushing above a multi-month falling trendline on the weekly chart and now retesting it from above.
The weekly chart shows SHIB inside an ascending channel, with higher lows and higher highs defining the structure since the breakout.
A break above the channel's upper boundary on rising volume opens a path toward $0.00000669, then $0.00000778, and $0.00000954.
A rejection from the upper boundary, or a break of $0.00000491 support, points toward $0.00000407 next.
Circulating supply already sits at 589.239T against a total supply of 589.496T, meaning dilution is barely a factor in this Shiba Inu price prediction September 2026 setup.
Weekly Chart Analysis
$SHIB spent months grinding lower under a falling trendline on the weekly chart, with each rally attempt capped at the same descending line.
Price recently broke above that trendline and is now retesting it from the topside, sitting inside an ascending channel formed since the breakout began.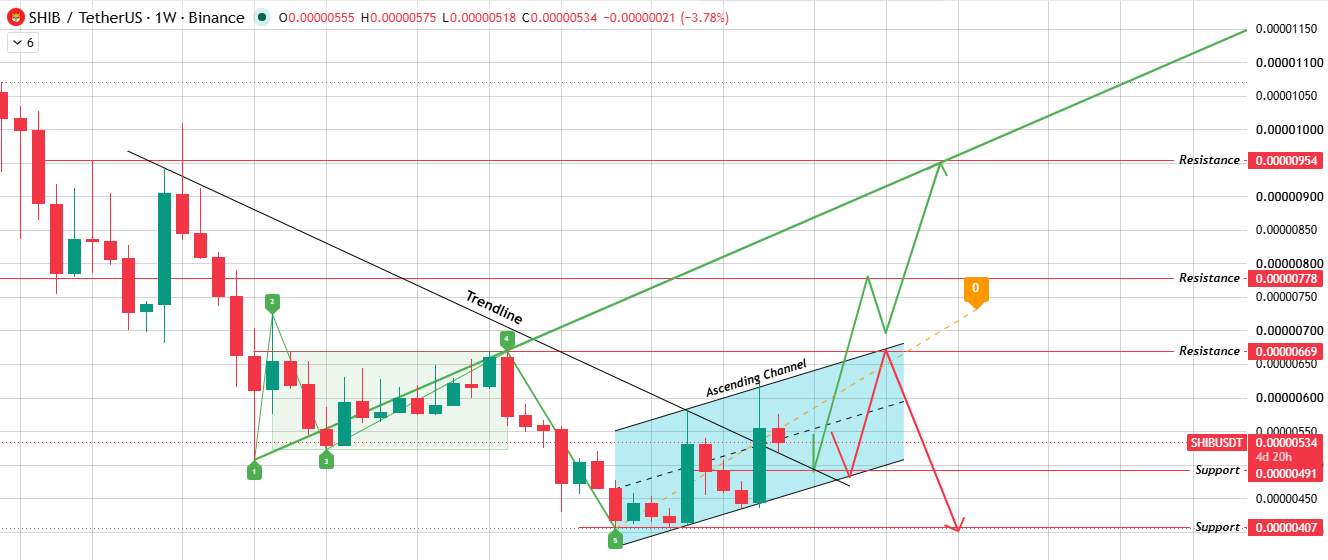
Source: Chart Taken From TradingView.
The setup is straightforward: if price clears the channel's upper boundary with volume behind it, $SHIB has room to run toward $0.00000669, then $0.00000778, and eventually $0.00000954, a zone the chart's Wolfe Wave projection marks as the next major level.
If the price instead gets rejected at that boundary, or the $0.00000491 support gives way first, the more likely path is a slide toward $0.00000407.
A failed breakout on weak volume tends to just become another lower high inside the channel, while a volume-backed break is what confirms the shift already signaled by the Wolfe Wave.
Technical Analysis: Key Support and Resistance
Level Type | Price |
Resistance 3 | $0.00000954 |
Resistance 2 | $0.00000778 |
Resistance 1 | $0.00000669 |
Support 1 | $0.00000491 |
Support 2 | $0.00000407 |
Shiba Inu Price Prediction September 2026: Bull, Base, and Bear Case
Scenario | Level | Setup | Invalidation |
Bull | $0.00000669 - $0.00000954 | $SHIB breaks above the channel's upper boundary on rising volume, holds the breakout on a weekly retest, and pushes through $0.00000669 and $0.00000778 toward $0.00000954. | Weekly close back inside the channel after the breakout |
Base | $0.00000491 - $0.00000669 | $SHIB holds $0.00000491 support but cannot clear the upper boundary with conviction, chopping inside the channel while volume stays light. | Extended consolidation without a confirmed break of either boundary |
Bear | $0.00000407 - $0.00000491 | The $0.00000491 support breaks, the trendline retest fails, and the price grinds down toward $0.00000407. | Reclaim and hold above $0.00000491. |
On-Chain and Fundamental Drivers (SHIB)
SHIB's market cap of $3.144B sits almost level with its fully diluted valuation of $3.145B, a gap so small that dilution barely factors into this forecast.
That near total circulation is unusual for a meme token this size and removes a major uncertainty that weighs on coins with large locked supplies.
Daily trading volume of $108.909M relative to market cap suggests solid liquidity, enough to support a genuine breakout if broader risk appetite returns to meme coins.
September Catalysts That Could Move the Price (SHIB)
Meme coin rotation remains a big lever for SHIB; when capital rotates into higher beta tokens, $SHIB tends to catch a share of that flow given its liquidity and brand recognition.
Shibarium network activity and updates tied to $SHIB's burn mechanism are worth tracking, since they are the closest thing SHIB has to a fundamentals-driven catalyst separate from sentiment.
Broader crypto risk appetite, tied to Bitcoin and Ethereum, tends to set the ceiling for how far a meme-adjacent token like $SHIB can run in any given month.
What Analysts Are Forecasting (SHIB)
Price level estimates for SHIB vary widely by source, with no strong agreement on a single September number across trackers.
The more reliable approach is to treat the technical levels above as the actual forecast: the ascending channel's upper boundary is the level bulls need to clear, and $0.00000491 is the level bears need to break for downside risk to extend toward $0.00000407.
Risks That Could Invalidate This Forecast (SHIB)
This entire picture rests on how SHIB behaves at the channel's upper boundary and the $0.00000491 support shelf.
A rejection at the upper boundary, especially on declining volume, would undo the recent trendline break and point back toward $0.00000491 first, then $0.00000407 if that breaks too.
Beyond the chart, a broad meme coin downturn or a slowdown in Shibarium activity would weigh on this setup regardless of technical positioning.
How to Buy and Store It Safely (SHIB)
$SHIB trades on most major centralized exchanges and can also be acquired through decentralized exchanges paired against ETH or stablecoins.
Stick to platforms with deep order books, since thinner liquidity spots see wider slippage during volatile weekly candles. For storage, small amounts are fine on an exchange, but larger holdings belong on a hardware wallet like a Ledger or Trezor.
Disclaimer: This article is for informational purposes only and does not constitute financial advice. Cryptocurrency markets are highly volatile, and prices can move sharply in either direction without warning. Always do independent research and consult a licensed financial advisor before making investment decisions.

















