Shiba Inu Price Prediction: $SHIB Is at the Edge of a Massive Move


Shiba Inu launched back in 2020 as a self-proclaimed "Dogecoin killer," and somehow that meme energy turned into one of the largest communities in all of crypto.
Years later, it's still one of the most recognized tokens out there, known as much for its massive supply and token burns as for its price swings.
Right now SHIB sits at $0.00000447, barely moved over the past day. This shiba inu price prediction builds from that number, working through what happens if the price breaks one way or the other from here.
Live Shiba Inu Market Data
| Metric | Value |
|---|---|
| Current Price | $0.00000447 |
| 24h Change | +0.1% |
| 24h High/Low | $0.00000451 / $0.00000437 |
| Market Cap | $2.637B |
| Fully Diluted Valuation | $4.476B |
| 24h Trading Volume | $58.051M |
| Circulating Supply | 589.24T SHIB |
| Total Supply | 589.496T SHIB |
Source: $SHIB market cap data taken from Coingecko, data as of Aug 13, 2026. Figures may vary slightly across other tracking websites.
Liquidation Snapshot
Coinglass data over the past 24 hours shows $79.01K in total liquidations, and this one's actually leaned toward longs, about $74.93K wiped compared to just $4.09K on shorts. 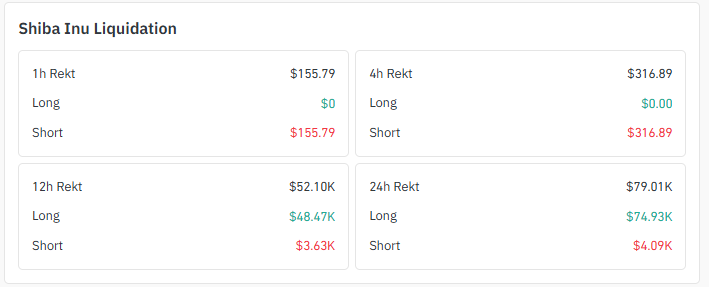
Source: Liquidation data taken from Coinglass.
That's a shift from shorter windows, though.
The 1h and 4h liquidations were almost entirely short-side, respectively. Mixed signals here, worth watching closely as the trendline test plays out.
Exchange Volume
OKX is running the show for SHIB volume right now at $12.02M, well ahead of the pack. LBank follows at $6.57M, with MEXC and Bitget close behind around $4-4.6M each. 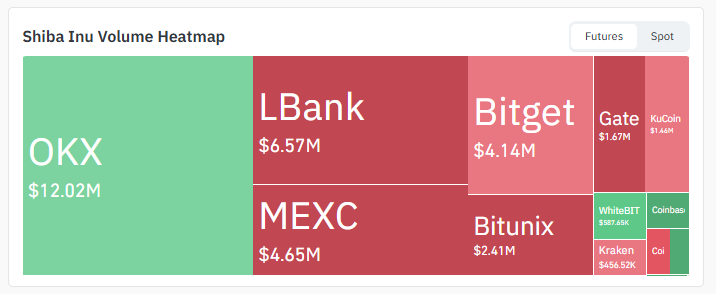
Source: Volume heatmap data taken from Coinglass.
Gate, KuCoin, WhiteBIT, Kraken, and Coinbase round out smaller slices. That kind of spread across so many venues usually points to broad, steady interest rather than volume concentrated in one corner.
Shiba Inu New Today
The Shiba Inu ecosystem's burn mechanism stayed active recently, with reports showing nearly 1.8 million $SHIB tokens burned in a single 24-hour window. 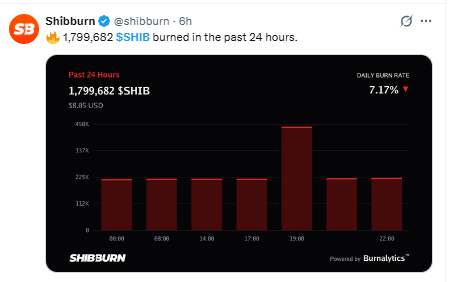
Source: Burn Rate Data Taken From @shibburn, X Account.
The burn rate did dip about 7% day over day, though, so it's not accelerating right now.
Burns alone rarely move price in any meaningful way given SHIB's enormous supply, but consistent activity here does say something about ongoing community engagement even while price chops sideways.
Key Takeaways
-
SHIB is trading around $0.00000447 right now, up just slightly on the day. Nothing dramatic yet, but the setup looks tense.
-
On the 4-hour chart, price is pinned under a descending trendline. That line's been capping every bounce for a while now.
-
Daily chart shows something bigger brewing too, SHIB sitting near the apex of a falling wedge.
-
Break the wedge and trendline to the upside, and $0.00000499 opens up, with $0.00000583 further out.
-
Fail here, though, and support gives way toward $0.00000405, with a much deeper Fibonacci level down at $0.00000295.
Technical Analysis for Shiba Inu Price Prediction
4-Hour Chart Analysis for $SHIB Prediction
The 4-hour chart has SHIB stuck under a descending trendline that's been rejecting every push higher.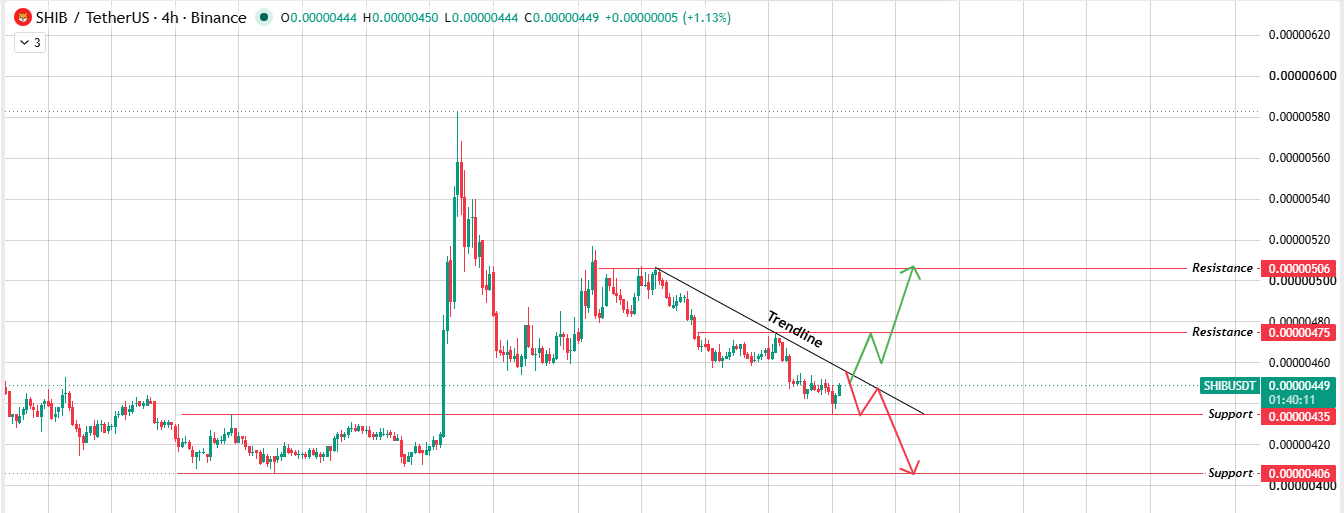
Source: Chart Taken From TradingView .
Break above it cleanly, and $0.00000475 comes first, followed by $0.00000506.
But if that rejection holds and support at $0.00000435 gives way, the price likely slides toward $0.00000406 next.
Daily Chart Analysis for $SHIB Prediction
Zoom out to the daily, and the picture gets more interesting. $SHIB is riding right at the apex of a falling wedge, a pattern that's been compressing for a while now and usually resolves with a sharp move. 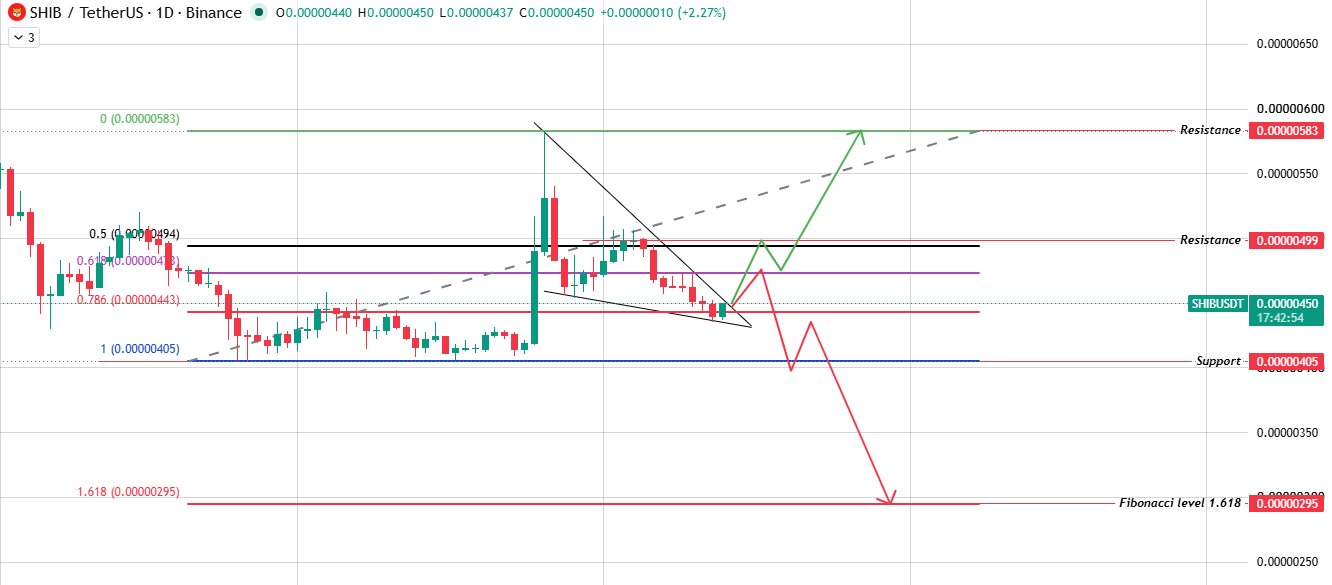
Source: Chart Taken From TradingView.
Break the upper boundary here, and $0.00000499 lines up as immediate resistance, with $0.00000583 as the bigger levels if buyers really step in.
Break the lower boundary instead, and support near $0.00000405 comes into play fast, with a steep drop toward the 1.618 Fibonacci level at $0.00000295 if selling accelerates.
Both charts are pointing at the same thing: SHIB's coiled tight, and the trendline break decides which way this goes.
Bull, Base & Bear Case
Here's how this shiba inu price prediction splits across three paths:
| Scenario | Outlook |
|---|---|
| Bull Case | Trendline and wedge resistance both break. Price climbs toward $0.00000499 first, then $0.00000583 if momentum holds. |
| Base Case | SHIB keeps grinding near the apex, chopping between $0.00000435 and $0.00000475 while the wedge tightens. |
| Bear Case | Rejection at the trendline drags price through support, down to $0.00000405, with $0.00000295 as the deeper Fibonacci level. |
Glossary
A descending trendline connects a series of lower highs, typically acting as resistance until broken.
A falling wedge is a pattern where price compresses between two downward-sloping, converging trendlines, often resolving bullish.
A Fibonacci level marks a mathematically derived price zone used to project potential support or resistance.
Liquidation refers to a leveraged position getting force-closed once losses exceed available margin.
Token burn is the permanent removal of tokens from the circulating supply. Circulating supply is the number of tokens currently available and actively trading.
Methodology
This Shiba Inu price prediction is based on 4H and 1D SHIBUSDT chart analysis on Binance, combined with live market data, Coinglass liquidation figures, exchange volume distribution, and recent burn rate data. All levels come directly from the charts provided, with nothing extrapolated beyond what's shown.
Disclaimer: This article is for informational purposes only and should not be treated as financial or investment advice. Cryptocurrency markets are highly volatile, and price predictions carry no guarantee of accuracy. Always do your own research and consult a qualified financial advisor before investing.

















