Solana (SOL) Price Eyes $110 as Disinflation Vote Passes, Whales Buy


Solana price prediction watchers have a lot to unpack this weekend. SOL is trading near $103.50, down 2.68% over the past day, even as the network just passed a major governance vote and hit a technical milestone.
The mixed picture is typical for crypto right now. Macro news is pulling prices down while on-chain fundamentals are pushing them up.
Below, we break down what happened, what the chart is saying, and what could come next.
Why Is Solana (SOL) Down Today?
The drop tracks back to comments from Fed Chair Kevin Warsh at the 2026 Jackson Hole Symposium. Traders did not like what they heard, and the reaction spread across the board. Bitcoin, Ethereum, and XRP all fell alongside Solana on the same news.
This is a macro story, not a Solana-specific one. When Fed officials signal caution on rate policy, risk assets tend to sell off together. SOL's 2.68% daily loss fits that pattern rather than pointing to any weakness in the network itself.
What Is Solana's Double Disinflation Vote (SGP-0002)?
While the price dipped, Solana's governance process quietly delivered a big result. SGP-0002, known as "Double Disinflation," cleared a stake-weighted vote with 67% support.
Here is how the vote broke down:
Vote Outcome | SOL Amount | Share |
In Favor | 176.29 million SOL | 67.00% |
Against | 66.19 million SOL | 25.16% |
Abstained | 20.63 million SOL | 7.84% |
Total Participation | 433.49 million SOL | 60.7% of stake |
Solana's rules require at least one-third of network stake to participate and two-thirds of participating stake to approve. This proposal cleared both bars, though only just. Support landed slightly above the 66.67% threshold needed to pass.
It is worth noting that an SGP sets direction, not code. The actual technical work falls to a separate document called SIMD-0550.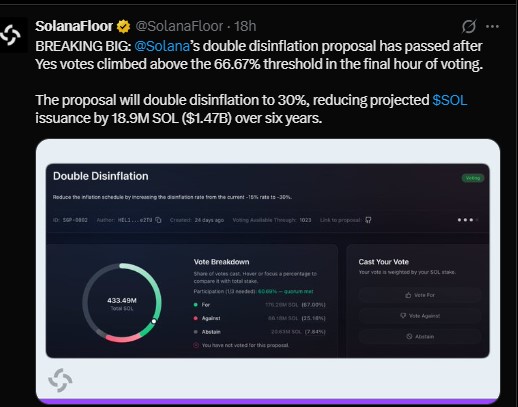
What Does SIMD-0550 Mean for SOL Supply?
SIMD-0550 was written by Helius contributors Lostin and 0xIchigo. It would double the rate at which Solana's inflation declines each year, from 15% to 30%.
This does not cut inflation in half overnight. Instead, it makes the existing schedule fall twice as fast from whatever level it sits at when the change goes live.
The practical effect is faster progress toward Solana's terminal inflation rate of 1.5%. Under the current schedule, that target arrives in about 5.7 years. Under SIMD-0550, it would arrive in roughly 2.8 years.
The authors estimate this removes 18.9 million SOL from projected issuance over six years. That works out to about 2.6% of the supply expected under the current path. Less new supply hitting the market, all else equal, tends to support price over time.
How Fast Is Solana's Slot Time Now?
Supply is not the only thing changing. Solana's block production speed also took a step forward.
The network's slot time dropped to 300ms for the first time, following the second reduction under SIMD-0525. That is a 25% cut in target slot time in just 8 days, down from 400ms.
Two more staged reductions are planned before the network reaches its final 200ms target. Faster slot times mean faster transaction finality, which matters for traders, DeFi apps, and anyone using Solana for payments.
Are Solana Whales Buying or Selling Right Now?
Onchain data shows large holders moving SOL off exchanges this week, a pattern often read as accumulation.
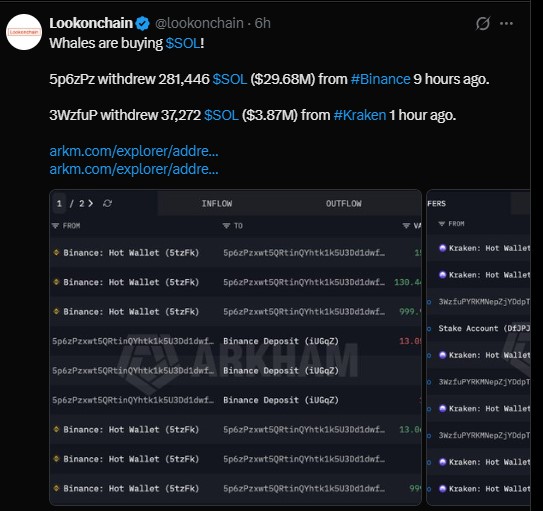
One wallet withdrew 281,446 SOL, worth about $29.68 million, from Binance nine hours ago.
A second wallet withdrew 37,272 SOL, worth about $3.87 million, from Kraken one hour ago.
Exchange withdrawals do not guarantee future price moves, but they do reduce the amount of SOL readily available for sale. Combined with steady ETF demand, it points to holders positioning for the medium term rather than a quick flip.
Spot Solana ETFs now hold 2.35% of SOL's entire circulating supply. That is a meaningful chunk locked into regulated investment products rather than sitting on exchanges.
For comparison, XRP ETFs pulled in $18.08 million in net inflows on August 28 alone, part of a nine-day streak that pushed total historical inflows past $1.34 billion.
XRP funds have taken in $192.62 million in August, outpacing most other altcoin ETF suites. Solana's ETF story is smaller in daily flow terms but growing in total supply share, which is arguably the more important long-term metric.
Solana Price Prediction: Key Levels To Watch
On the daily SOL/USDT chart, the picture has shifted. Price broke out of a long descending channel with a strong upward move and now sits above the 20, 50, 100, and 200 EMAs. That alignment usually signals a real change in momentum, not just a bounce.
Here is the current technical roadmap:
Level | Price Zone | What It Means |
Immediate Target | $110-$115 | Pattern target from the breakout |
Next Resistance | $118-$125 | Opens if $110 breaks and holds |
Extended Target | $135-$145 | Possible if $118-$125 clears |
Healthy Pullback Zone | $95-$100 | Normal cooldown given overbought RSI |
Invalidation Level | $90-$92 | Daily close below here weakens the setup |
The RSI is sitting near 73, which is overbought territory. That does not mean a crash is coming, but it does raise the odds of a pause or pullback before the next leg up. A dip toward $95-$100 before continuation would not be unusual and could actually be healthy for the trend.
Some analysts also flag the $107-$119 range as an important continuation zone to watch in the coming sessions.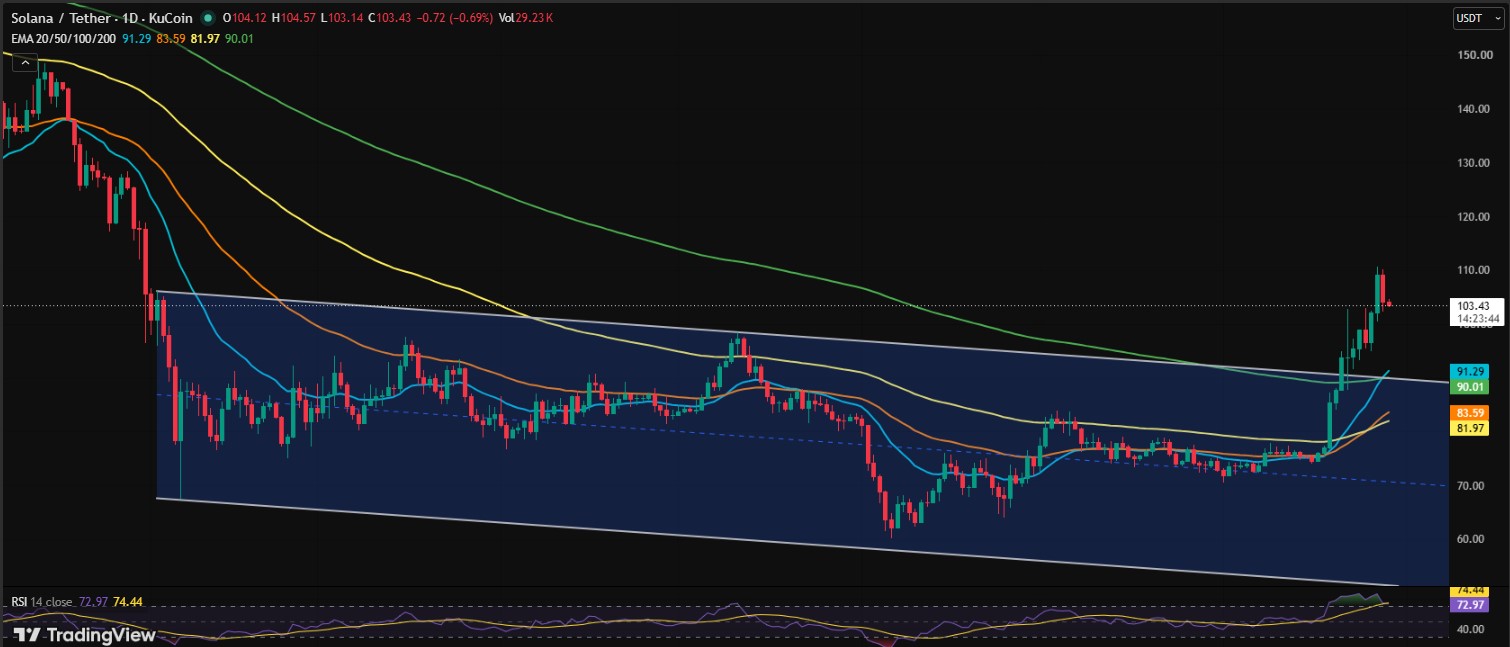
Nothing here is a guarantee. Crypto markets can turn quickly, and macro headlines like the Jackson Hole comments show how fast sentiment can shift regardless of what the chart says.
Disclaimer
This article is for informational purposes only and does not constitute financial, investment, or trading advice. Cryptocurrency markets are highly volatile, and prices can rise or fall sharply within short periods. Past performance and technical patterns do not guarantee future results. Always conduct your own research and consult a licensed financial advisor before making investment decisions.
Also read:

















