Stablecoin Price Prediction: Can Momentum Take It to $0.05?


Stablecoin (STABLE) has been a tricky one to read lately, and that's exactly why this Stablecoin price prediction matters right now.
The token has been sliding inside a falling channel for weeks, but the last 24 hours brought a modest bounce that's got traders paying attention again.
Here's what's happening and what the chart says about where $STABLE could head next.
Where Does Stablecoin's Market Valuation Stand Today?
Let's start with where things stand. $STABLE is trading at $0.02866, up 6.82% over the past day.
According to Coinglass data, that puts its market capitalization at $737.85 million, with a circulating supply of 25.91 billion tokens out of a fixed total and max supply of 100 billion $STABLE.
Since so much supply remains uncirculated, this market cap reflects only a fraction of the token's fully diluted value.
Is the Derivatives Market Reacting to the Bounce?
As per Coinglass data, positioning across derivatives desks points to quiet accumulation.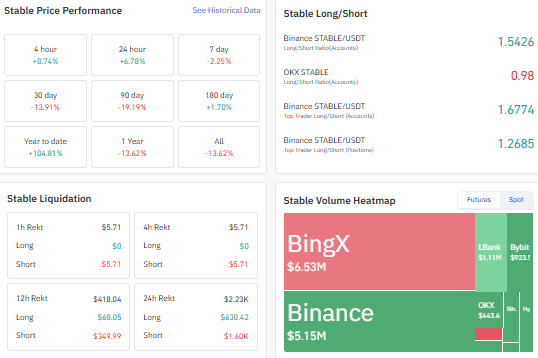
The Binance STABLE/USDT long/short ratio sits at 1.5426, while OKX's ratio is closer to even at 0.98. Binance's top-trader long/short ratio by accounts runs higher at 1.6774.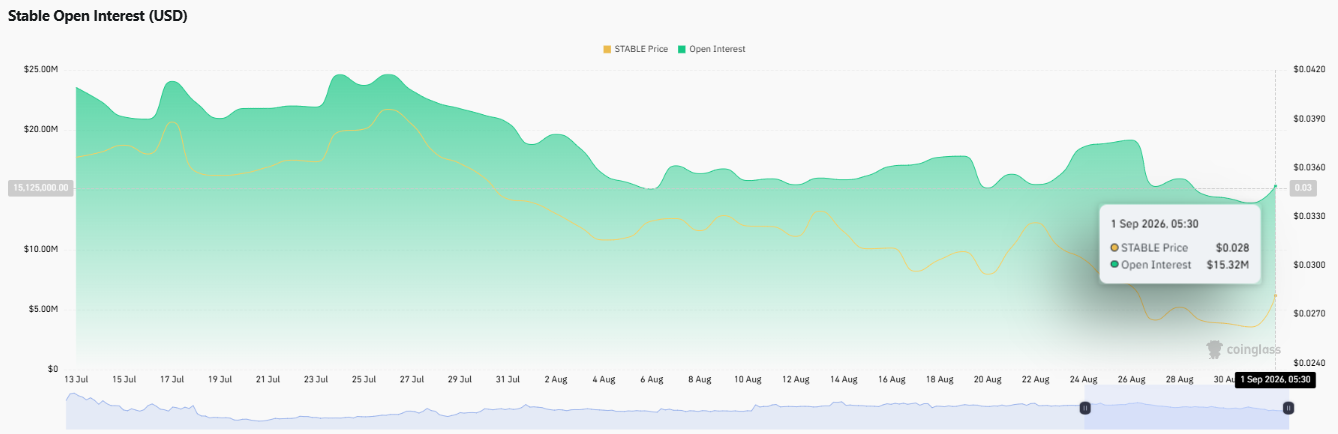
Open interest has ticked up to $15.69 million, and 24-hour liquidations remain minimal at roughly $2,230, mostly short positions, suggesting the bounce caught a few short sellers off guard.
What Does On-Chain Activity Show for Stablecoin?
On-chain, the picture looks steady rather than explosive. As per Stablescan data,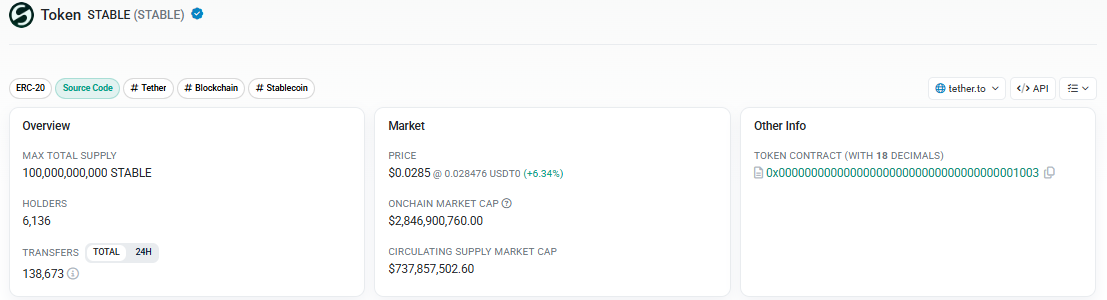
$STABLE currently has 6,136 holders, and the network processed 138,673 transfers in the past 24 hours alone, meaningful daily activity for a token still early in its holder growth curve.
Stablecoin Price Outlook: Bull, Neutral, and Bear Scenarios
Outlook | Trigger | Key Levels |
Bull | Confirmed breakout above the channel, held with rising volume | $0.03417, $0.04175, $0.04515, $0.05001 |
Neutral | Price oscillates between channel resistance and support | $0.02796 – $0.03417 |
Bear | Break and hold below the channel's mid-line support | $0.02490, $0.02031 |
What Is the STABLE Price Chart Signaling Next?
Per the TradingView chart, $STABLE is trading inside a descending channel, recently bouncing off support near the channel's low at $0.02490 and now holding close to the midline $0.02796, with $0.03417 acting as the immediate resistance overhead.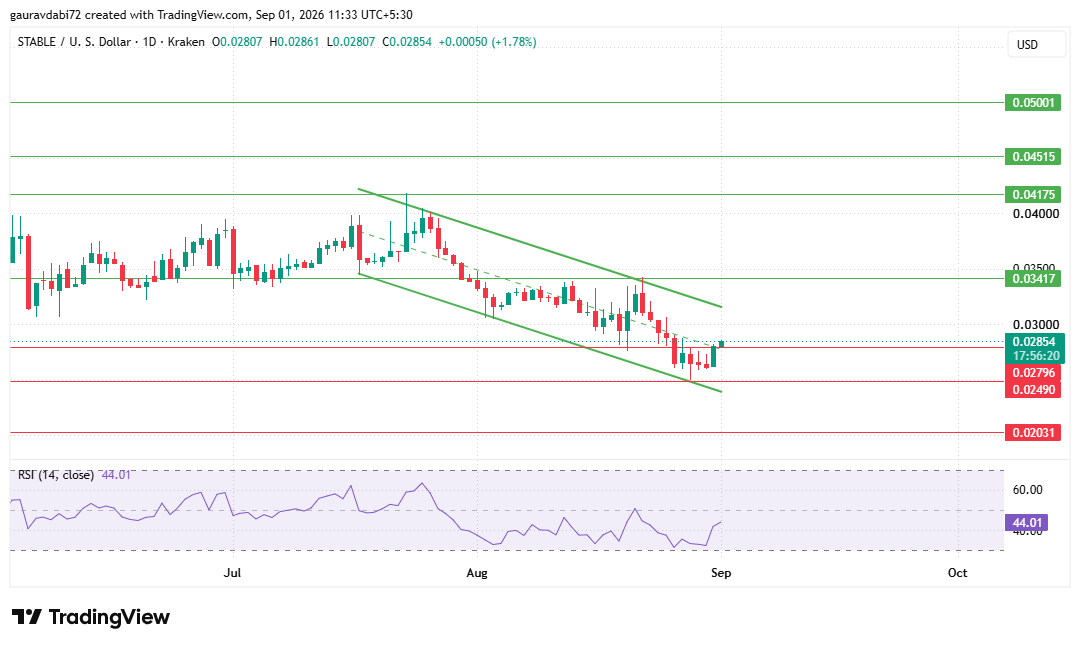
However, if price manages to break above the channel and hold that breakout, the next stretch of resistance opens up at $0.04175, then $0.04515, and eventually $0.05001.
That's the scenario this Stablecoin price prediction is watching most closely, because a confirmed breakout would shift the broader structure.
On the downside, a pullback could send the price back toward $0.02490 and then $0.02031 if momentum fades.
In a neutral scenario, STABLE simply oscillates between roughly $0.03417 and $0.02796.
The 14-day RSI reads 44.01, still below the neutral 50 mark, meaning momentum hasn't fully turned bullish yet even though price has ticked higher.
Analyst View
As per the CoinGabbar analyst desk, STABLE's attempt to hold the channel's mid-line, combined with improving but still sub-50 RSI and steady on-chain activity, suggests a token in a wait-and-watch phase rather than a confirmed reversal.
Whether this Stablecoin price prediction plays out toward $0.05 will likely come down to whether STABLE can close and hold above $0.03417 in the sessions ahead.
Disclaimer: This article is for informational purposes only and does not constitute financial, investment, or trading advice. Cryptocurrency markets are highly volatile and unpredictable; readers should conduct their own research before making any decisions. CoinGabbar and the author bear no responsibility for losses incurred based on this content.
Also read:
















