Wall Street’s Next Crypto Bet? $XLM 12% Up: Stellar Price Prediction


Stellar is having a moment. XLM is up 12% today near $0.18798, TVL on the network is climbing fast, and Wall Street chatter is heating things up with talk of tokenized assets coming to the network in 2027.
This Stellar Price Prediction looks at what's driving the move and whether the excitement matches the bigger picture.
Market data was checked on August 21, 2026, at 11:48 IST.
Stellar Price Prediction Today: Market Overview
Metric | Value |
Price | $0.18798 |
24h Change | +12% |
Market Cap | $6.47B |
24h Change (Market Cap) | +12.02% |
Unlocked Market Cap | $9.41B |
24h Volume | $353M+ |
24h Change (Volume) | +104.99% |
Vol/Mkt Cap (24h) | 5.43% |
FDV | $9.36B |
Total Supply | 50B XLM |
Max Supply | 50B XLM |
Circulating Supply | 34.57B XLM |
Source: Data from CoinMarketCap as of August 21, 2026, at 11:48 IST. Figures may vary slightly across other tracking websites.
Why Is XLM Price Up Today?
XLM jumped about 12% in a day, lifted by a broad crypto rally after the U.S. Treasury expanded its long-term bond buyback program, doubling long-end buybacks to at least $4 billion per operation.
This eased yields and boosted risk appetite across altcoins, XLM included.
It's a market-wide move, not a Stellar-specific announcement, so the network's underlying fundamentals haven't changed.
Whether the gains hold depends on yields, future buyback decisions, and broader crypto sentiment.
Wall Street and Stellar: What Could Be Coming Next
DTCC and DTC are reportedly planning to bring tokenized assets, including U.S. Treasuries, ETFs, and Russell 1000 securities, to Stellar starting in 2027. 
Source: Data from X
Franklin Templeton, PayPal, Visa, and Mastercard are already building on the network in different ways, and Stellar has crossed $3B in tokenized real-world assets.
Note: This is unconfirmed and multi-year in scope, so CoinGabbar could not independently verify the details.
XLM Price Prediction Chart: Technical Analysis
Pair: XLM/USD · Market: Spot (Crypto) · Timeframe: 1D · Source: TradingView · Timestamp: August 21, 2026, 11:48 UTC+5:30
XLM closed at $0.18798, after breaking above a descending trendline that had capped rallies since late May.
The breakout has been confirmed, and holding above the current support level is keeping the bullish momentum intact.
If this support continues to hold, the price could extend its move higher.
The breakout pushed the price clear of $0.18111, now the first support, with a deeper support at $0.17005.
RSI (14) sits at 68.02, showing strong momentum without being deeply overbought.
The EMA cluster sits below the current price, with EMA 20 at $0.16796 and EMA 50 at $0.17384, both acting as support.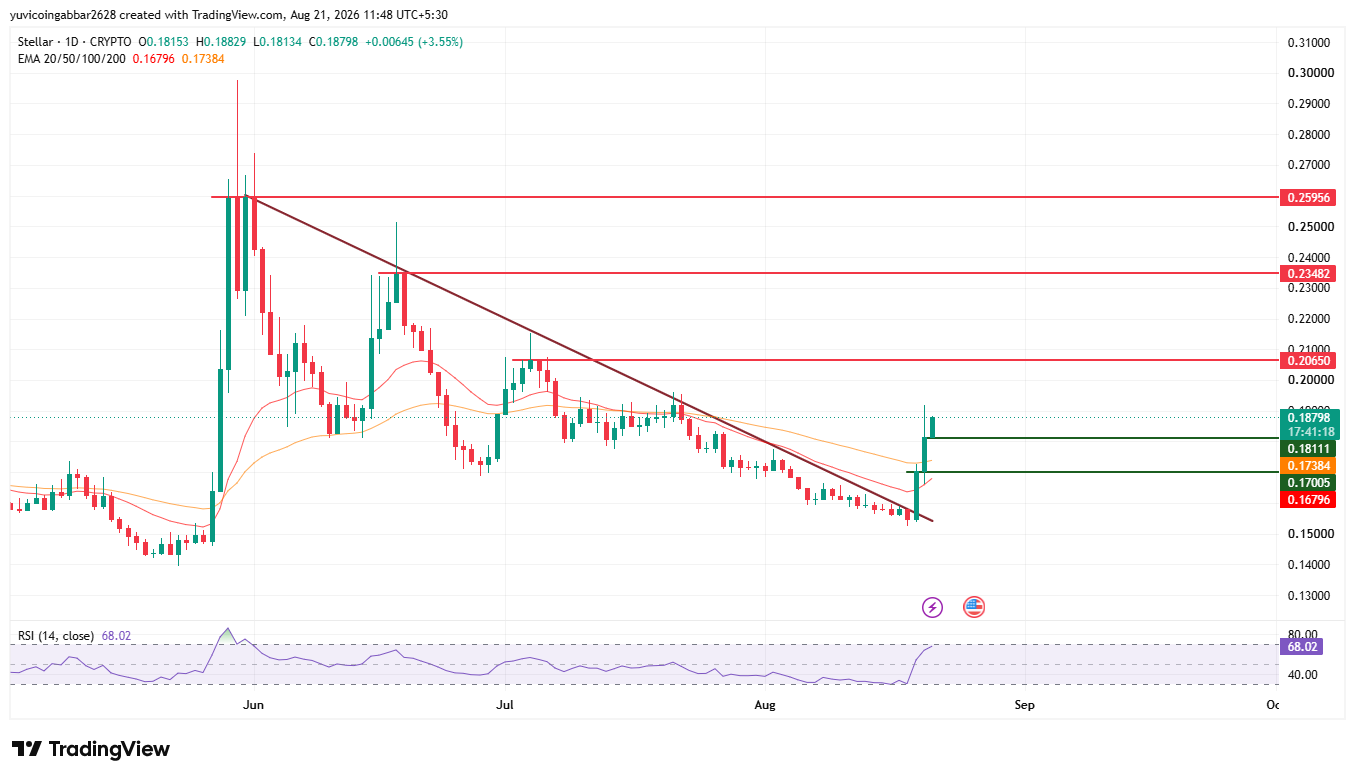
Important Levels
Level Type | Price |
Resistance 3 | $0.25956 |
Resistance 2 | $0.23482 |
Resistance 1 (nearest) | $0.20650 |
Immediate Price Reference | $0.18798 |
Nearest Support (breakout zone) | $0.18111 |
Deeper Support | $0.17005 |
Stellar Forecast: Bull Case vs Bear Case
$XLM price target 2026 Bull case: Holding above $0.18111 and the EMA cluster near $0.16796 to $0.17384 keeps the breakout intact.
A close above $0.20650 opens the path toward $0.23482 and eventually $0.25956.
$XLM price target 2026 Bear case: A close back below $0.18111 puts the breakout in doubt, since this move is macro-driven rather than Stellar-specific.
Losing $0.17005 and the EMA cluster near $0.17384 exposes $0.16796 next.
Price Scenarios: Triggers and Invalidation
Scenario | Trigger | Likely Outcome | Invalidation Point |
Trendline hold | Price stays above $0.18111 | Push toward $0.20650 | Close below $0.18111 |
Resistance breakout | Close above $0.20650 | Move toward $0.23482, then $0.25956 | Rejection back below $0.18798 |
Pullback | RSI cools from 68.02 | Retest of EMA cluster $0.17384 to $0.16796 | Break below $0.16796 |
Can XLM Reach $0.25956?
$0.25956 is the highest resistance marked on the chart. Reaching it would require XLM to first clear $0.20650, then $0.23482, a multi-stage move rather than a single leg.
Stellar Price Prediction: Expert View
According to CoinGabbar analysts, XLM's rally today is part of a broader altcoin bounce tied to Treasury liquidity easing, not a Stellar-specific catalyst, but the network's own TVL and fee growth suggest real activity sitting underneath the move.
RSI at 68.02 leaves room to run before the chart looks stretched.
The Wall Street tokenization narrative adds a longer-term angle worth watching, even though it's still unconfirmed.
The $0.18111 zone is the level that matters most right now.
Disclaimer
This piece is for informational purposes only and is not financial advice. The levels and scenarios above are based on technical chart analysis and publicly available data at the time of writing. Crypto markets can move sharply within hours, so past patterns do not guarantee future outcomes. It is worth doing independent research and considering your own risk tolerance before acting on any of the levels discussed here.











.webp)





