Stellar Price Prediction: Can XLM's Growth Spark a Breakout?


Network fundamentals don't get much stronger than this. 2.90 billion successful operations, 3.59 million active addresses, and $11.4 billion in stablecoin volume over the past year, alongside record developer activity and reported progress on DTCC connectivity Stellar just posted some of its best numbers ever.
That's a real institutional-grade usage story building underneath the network.
But this Stellar Price Prediction has to reckon with a chart that isn't listening.
XLM is stuck inside a descending channel on both the daily and 1-hour timeframes; longs are getting liquidated by the day, and open interest is quietly draining out of the market.
Is the network's growing utility enough to turn the tide, or does price need to break structure first before the fundamentals matter?
Why Are Traders Watching Stellar's Institutional Story?
Stellar's pitch to institutions just got a lot more concrete. Per network data shared on X by analyst @thebu11runner, citing the Allium dashboard, the past 12 months saw 2.90B successful operations, 3.59M active addresses, and 2.44M new addresses onboarded.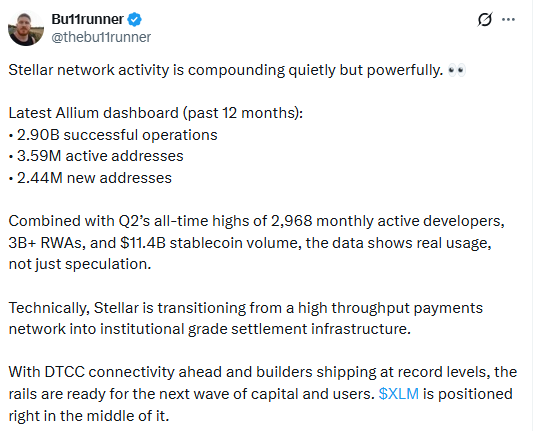
While Q2 alone delivered all-time highs of 2,968 monthly active developers, $3B+ in tokenized real-world assets, and $11.4B in stablecoin volume moving across the rails.
That's a genuine expansion of Stellar's role as settlement infrastructure, not a confirmed driver of price.
Traders now have a real reason to pay attention to the network's institutional pivot; whether that demand shows up on the chart is still the open question.
Are XLM Derivatives Traders Convinced Yet?
Open interest tells a story of retreat. XLM's OI now sits at $164.81M, down sharply from a peak above $600M in early July, with a smaller secondary spike in late July that has also mostly unwound. Leverage is cooling, not building.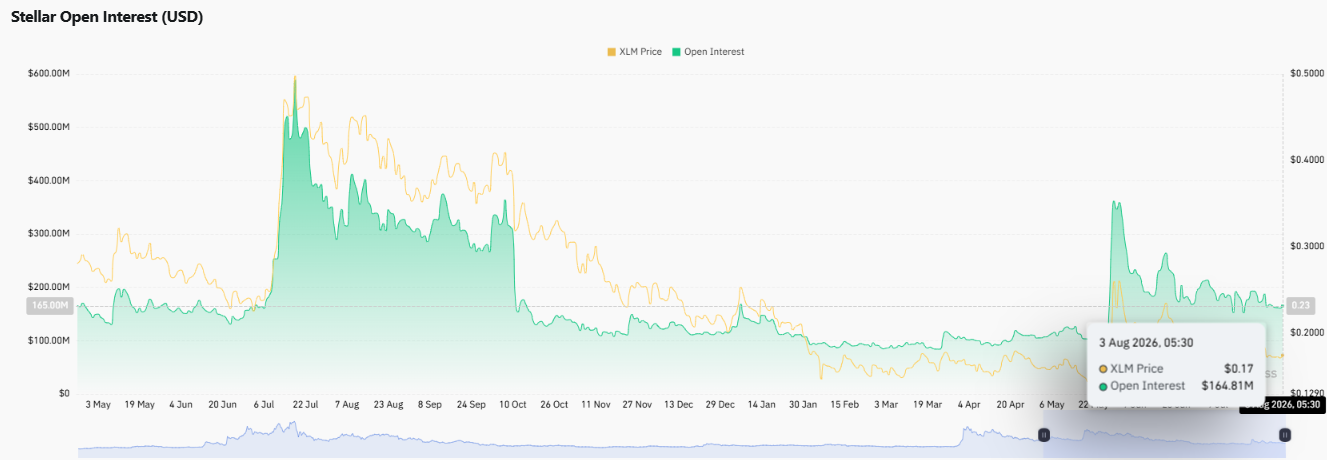
Positioning is mixed depending on where you look: Binance's XLM/USDT account ratio sits almost perfectly balanced at 1.0169, while OKX's is much more long-skewed at 1.77.
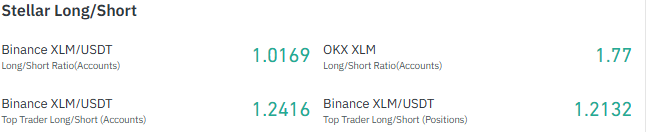
Binance's top traders lean long too, both by account (1.2416) and by position size (1.2132), meaning the bigger bets on Binance are still tilted bullish even as OI shrinks overall.
Liquidations make the near-term pain clear. Over 24 hours, $30.32K of the $30.64K in total liquidations came from longs, over 99% of the damage.
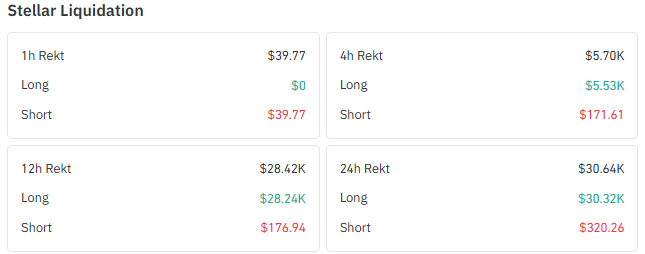 That pattern holds across the 12-hour window too ($28.24K of $28.42K from longs), though the most recent hour flipped, with the full $39.77K in 1-hour liquidations coming from shorts instead.
That's a market that's been grinding longs lower for most of the day, then catching a short squeeze in the most recent hour.
Data source: coinglass
What Does XLM's Recent Price Action Say?
XLM is down 2.08% over 24 hours and down 5.92% over the past week, a clear short-term downtrend. The 30-day figure is worse still, down 15.90%.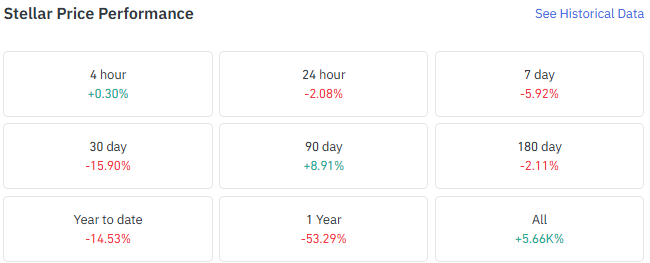
Zoom out, though, and the picture is less one-sided: XLM is up 8.91% over 90 days, even after giving back a big chunk of that gain in the past month.
Year to date, XLM is down 14.53%, and over the past year it's down 53.29%, a reminder that XLM remains well off its cycle highs even as its all-time return sits at a staggering +5,660%.
Daily and 1-Hour Chart: Both Timeframes Agree, For Once
On the daily chart, XLM trades around $0.1713, inside a descending channel that's been intact since early July's spike toward $0.24. RSI reads 39.58, soft but not yet oversold.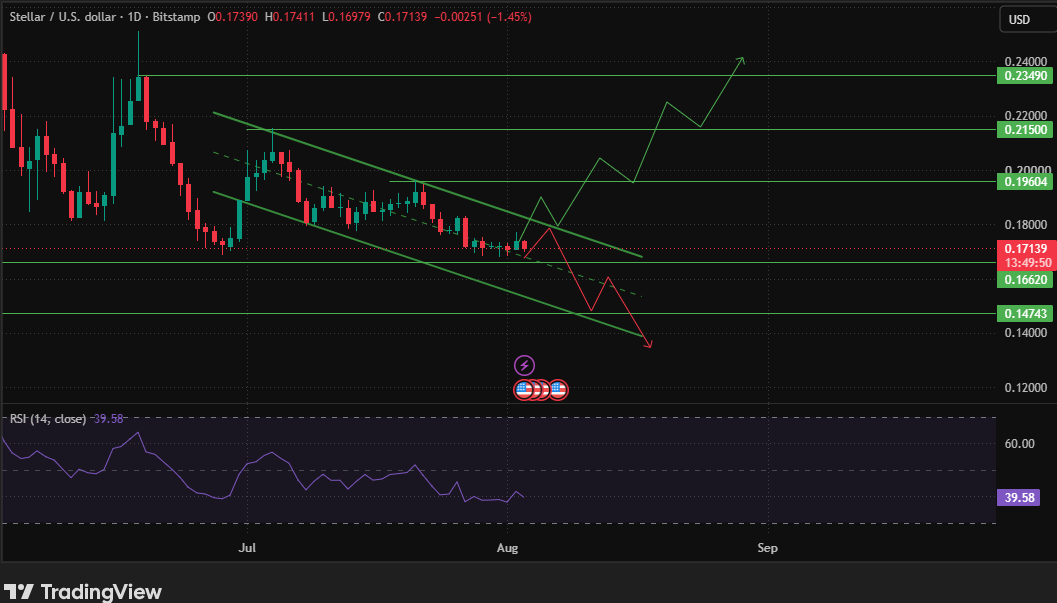
A breakdown below the channel's current floor opens a path toward $0.1662, then $0.1474. A breakout of the channel and a sustainable move through $0.1960 would shift the picture, opening $0.2150 and then $0.2349 above that.
The 1-hour chart mirrors the same structure on a tighter scale. XLM is trading around $0.17135, still inside its own descending channel.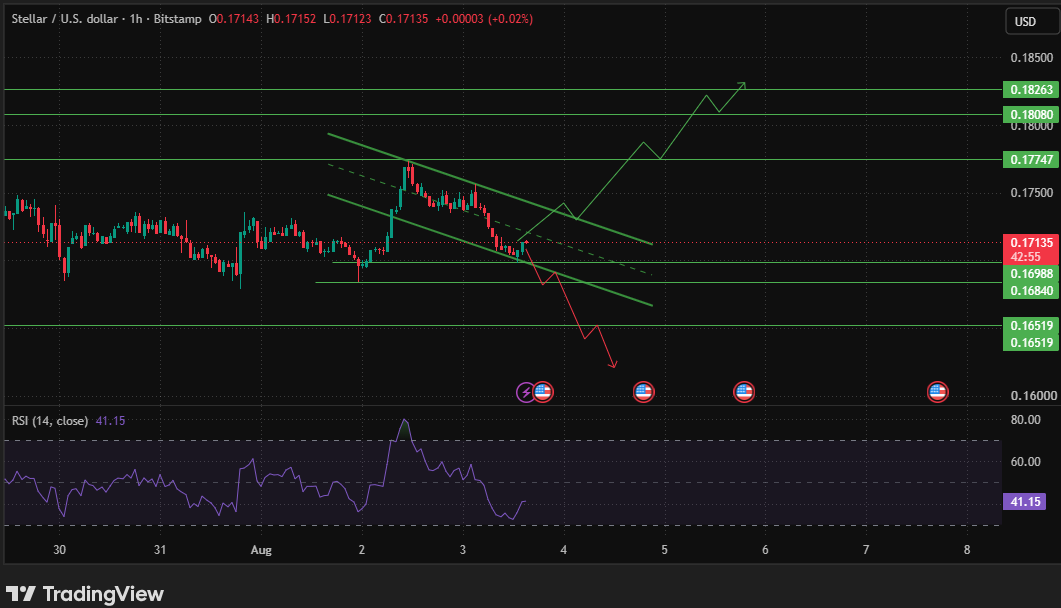
With RSI at 41.15, a break above the channel and a sustained price above $0.17747 would open $0.18080, then $0.18263. Below the current range, $0.16988 and $0.16840 are the levels that matter if the channel gives way, with $0.16519 next in line.
Unlike setups where timeframes disagree, this is a case where XLM technical analysis lines up on both charts, and neither one is bullish yet.
Data source: TradingView
Where Does That Leave XLM's Sentiment?
The fundamentals are arguably the strongest part of this Stellar Price Prediction right now: real network growth, record developer activity, and institutional settlement progress.
But the derivatives data show longs taking the brunt of the damage, OI is shrinking rather than building, and both the daily and 1-hour charts remain locked in descending channels.
Until price actually breaks structure, the bigger picture stays cautious even as the on-chain story builds.
Stellar Price Prediction: Three Scenarios for XLM
Scenario | Trigger | Price Outlook |
Bullish | XLM breaks above its daily descending channel and sustains above $0.17747 on the 1-hour chart. | Opens a path toward $0.1960, then $0.2150 and $0.2349 on the daily chart, with $0.18080 and $0.18263 as the near-term 1-hour levels leading the way. |
Base Case | XLM holds above $0.1662 on the daily chart, while the 1-hour range oscillates between $0.16840 and $0.17747. | Consolidation continues as the market tests whether cooling leverage and easing long liquidations can stabilize price before the next directional move. |
Bearish | XLM loses $0.1662 on the daily chart, with the 1-hour chart breaking below $0.16519. | Opens the door to $0.1474 if the broader channel breakdown continues, with long liquidations likely accelerating on the way down. |
Strong Fundamentals, Still-Falling Chart
Stellar's institutional and payments story is genuinely building; record active addresses, record developer activity, and billions in stablecoin volume don't happen by accident.
But none of that has yet been enough to break XLM out of its descending channel, and derivatives traders betting on a bounce have been paying the price in liquidations.
$0.1662 on the daily chart and $0.1698 on the 1-hour chart are the levels that decide whether the downtrend accelerates or finally exhausts itself.
Until one of those breaks, this Stellar Price Prediction stays a wait-and-confirm setup rather than a directional call.
Disclaimer: This analysis is for informational purposes only and does not constitute financial advice. Cryptocurrency markets are volatile, and readers should conduct their own research before making investment decisions.


















