TRON Price Prediction August 2026: Is TRX About to Shock the Market

TRON price prediction August 2026 are picking up as TRX holds right at a support zone that both the daily and weekly charts have been building toward for weeks.
Two separate chart structures are now converging on the same decision point, and how TRX handles this level could shape its next big move through August.
Traders are watching closely because a break in either direction here tends to travel fast.
TRON Price Today: Live Data and 24-Hour Change
| Metric | Value |
| Price | $0.32585 |
| 24h Change | -0.02% (-$0.00006518) |
| Market Cap | $30.89B |
| Futures Volume (24h) | $108.11M |
| Spot Volume (24h) | $31.47M |
| Open Interest | $239.37M |
| Circulating / Total Supply | 94.88B TRX |
Sourced from CoinGlass TRON market data alongside the live TradingView chart, captured July 29, 2026, around 2:36 PM IST.
For a continuously updated read on where TRX stands right now, our today's TRX price update tracks these numbers as they move.
On-Chain and Fundamental Drivers (TRON)
Beyond the chart, this TRX outlook also rests on a steady fundamental backdrop.
As per a recent post from TRON DAO, the network's Q2 momentum extended across network growth, institutional adoption, compliance, education, and emerging AI infrastructure.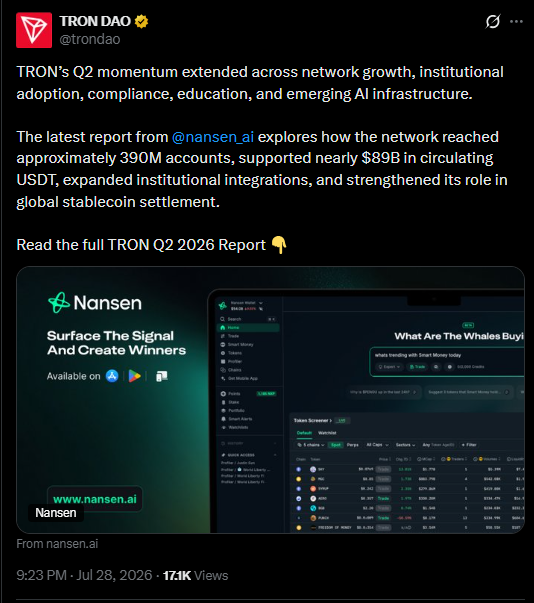
The cited Nansen report shows TRON has reached approximately 390M accounts, supports nearly $89B in circulating USDT, and continues expanding institutional integrations and its role in global stablecoin settlement.
That kind of steady building activity does not move price on its own, but it adds a longer-term credibility layer underneath the technical setup unfolding on the chart right now.
Daily Chart: ascending Triangle Support Test
On the daily timeframe, TRON is trading inside an ascending triangle, and price is currently trading right at support inside it.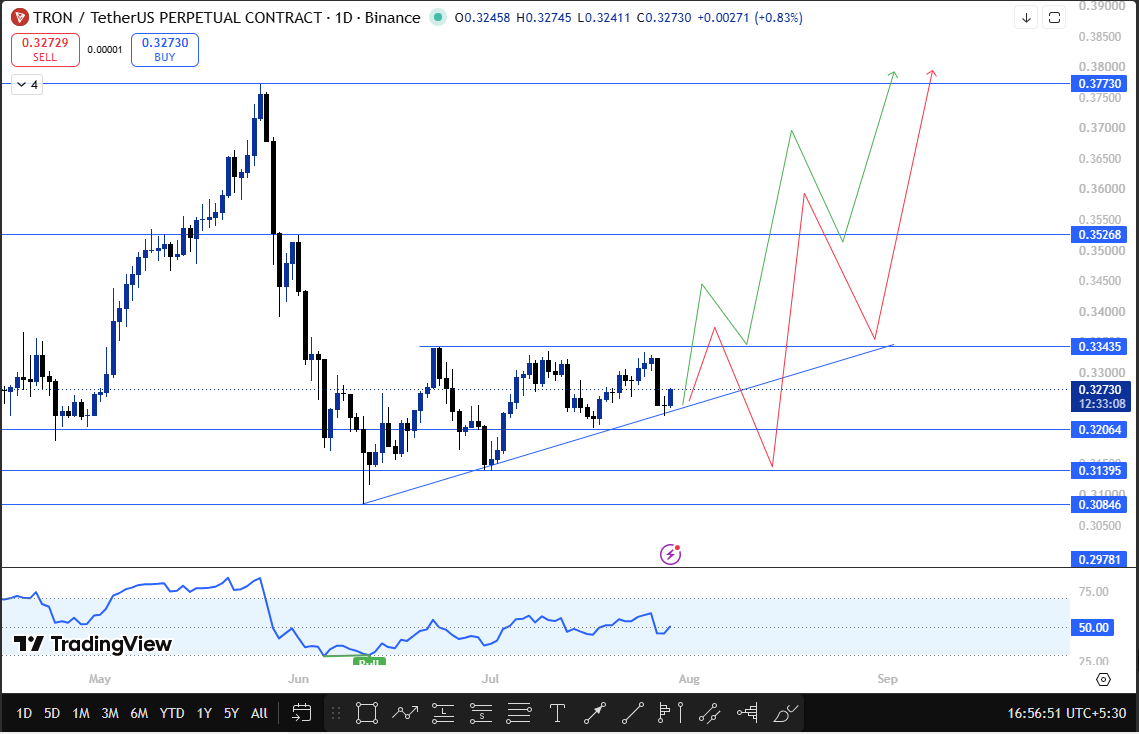
If $TRX holds this support and later breaks and closes above $0.33405, the next resistance opens at $0.35268, then $0.37730 and higher.
If instead the price breaks and closes below $0.32065, the next support zone shifts to $0.31395 and $0.30846, and the buying view is invalidated once TRX closes below that level on the daily chart, a scenario covered further in our piece on whether TRX is ready for a breakout.
Weekly Chart: Ascending Channel Support Test
A similar setup shows up on the weekly chart, where TRON has been climbing inside an ascending channel, and the price is now trading near its support boundary.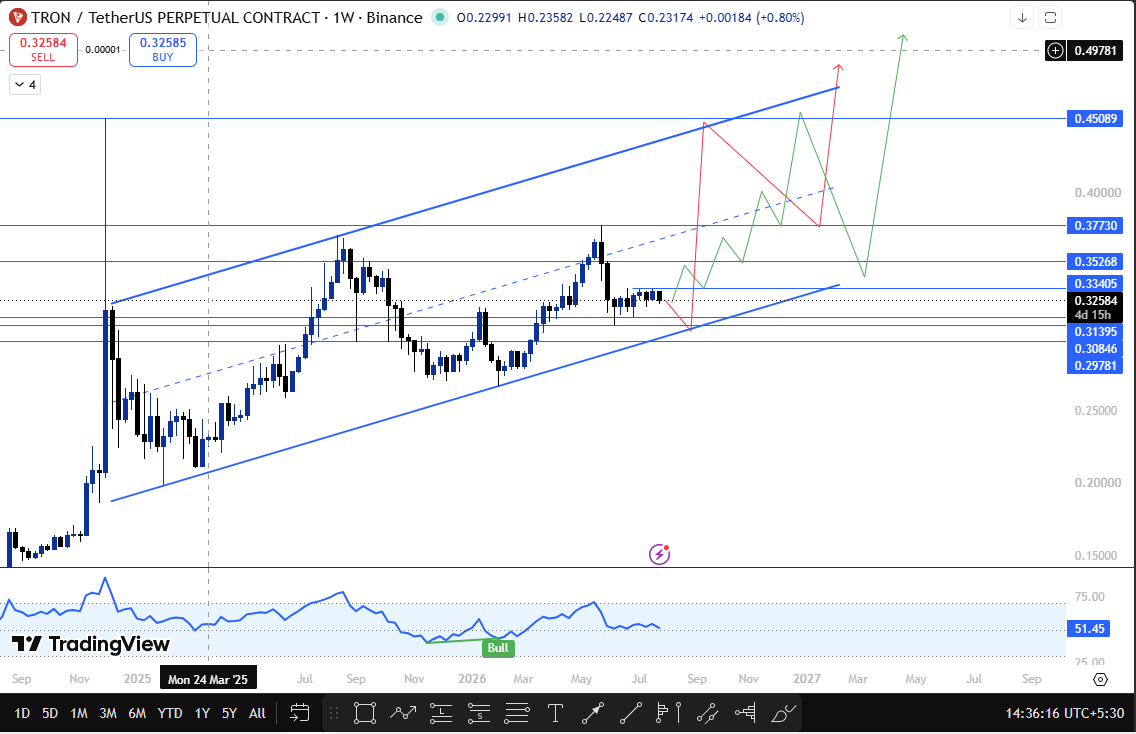
If $TRX breaks and closes above $0.33405 on this timeframe, resistance opens at $0.35268 and then $0.37730, with $0.45089 as the extended target if buyers stay in control through August.
If instead the weekly candle breaks and closes below $0.30861, the buying view is invalidated, and focus shifts down to $0.29781 as the next support.
$TRX Bull, Base and Bear Cases For August
For the broader multi-year backdrop behind these levels, see our full TRON price prediction covering 2026, 2027, 2028, and 2029.
-
Bull case: a confirmed close above $0.33405 on either timeframe opens room toward $0.35268 and $0.37730, with $0.45089 as the weekly stretch target if August momentum holds
-
Base case: $TRX continues consolidating around the current support zone through most of August, with no confirmed breakout either way for now
-
Bear case: a confirmed daily close below $0.32065, or a weekly close below $0.30861, shifting focus down toward $0.31395 and $0.30846 on the daily and $0.29781 on the weekly
Base Case: Range-Bound Consolidation at Support
The base case, and arguably the more likely near-term outcome for a good stretch of August, is continued consolidation right around this shared support zone.
$TRX has spent weeks compressing inside the triangle on the daily chart and testing the lower boundary of the ascending channel on the weekly, and without a volume-driven breakout in either direction, that range-bound behavior could persist through much of the month.
Bear Case: Breakdown Risk
The bear case triggers on a confirmed daily close below $0.32065 or a weekly close below $0.30861.
On the daily, that shifts focus to $0.31395 and then $0.30846. On the weekly, it invalidates the broader buying view entirely and opens room down to $0.29781, a level detailed further in our TRX price analysis.
TRON Technical Analysis: Key Support and Resistance Levels
| Timeframe | Trigger | Resistance Targets | Breakdown Trigger | Support Targets |
| Daily | Close above $0.33405 | $0.35268, $0.37730+ | Close below $0.32065 | $0.31395, $0.30846 |
| Weekly | Close above $0.33405 | $0.35268, $0.37730, $0.45089 | Close below $0.30861 | $0.29781 |
Across both timeframes, the closing price matters far more than a wick through either boundary.
A brief spike above $0.334 or below $0.320 that fails to hold by the candle's close does not confirm anything on its own, which is worth remembering given how tight this consolidation has become.
Risks That Could Invalidate This Forecast (TRON)
This forecast holds only as long as TRX respects the ranges above.
A failed breakout above $0.33405 that reverses back into the triangle would undercut the bull case, while a decisive break below $0.32065 on the daily or $0.30861 on the weekly without a bounce would suggest deeper weakness than the base case assumes.
August also carries its usual event risk around broader crypto market sentiment, and a sharp move in Bitcoin or Ethereum could pull TRX along with it regardless of where these specific levels sit.
Conclusion
The base case for August remains $TRX holding around this shared support zone, with no confirmed breakout in either direction until one of those levels gives way on a closing basis.
This for August 2026 assumes the current support holds, and it is invalidated the moment TRX closes decisively below $0.32065 on the daily or $0.30861 on the weekly.
August 2026 carries its own event and volatility risk beyond these charts, so this analysis should be treated as one input for your own research, not financial advice.
Disclaimer
This article is for informational purposes only and does not constitute financial advice. Cryptocurrency markets are highly volatile. Please verify current data independently and consult a licensed financial advisor before making any investment decisions.









.jpg)








