AI Crypto Price Predictions August 2026: Top AI Coin Watchlist


This roundup of AI crypto price predictions August 2026 starts with the number that matters most: most of the AI token basket just gave back a chunk of its summer gains in a single red week, and that's the story worth understanding before chasing any bounce.
As of July 29, 2026, seven of the eight AI-linked tokens we track are down on both the daily and weekly charts, with only Bittensor holding a positive daily print. Near-term direction leans cautious. Key levels and a base-case range for each token are laid out below, along with what would break the thesis in either direction. For the wider market backdrop, our full price prediction hub tracks these levels alongside the rest of the market.
Table of Contents
-
Why AI Tokens Are Under Pressure Right Now
-
AI Crypto Price Predictions August 2026: Coin by Coin
-
Bittensor (TAO) Price Prediction
-
Render (RENDER) Price Prediction
-
Fetch.ai (FET) Price Prediction
-
NEAR Protocol Price Prediction
-
Grass (GRASS) Price Prediction
-
io.net (IO) Price Prediction
-
Akash Network (AKT) Price Prediction
-
Virtuals Protocol (VIRTUAL) Price Prediction
-
Where Ozak AI Fits In
-
Key Takeaways
-
Glossary
-
Methodology
Why Everyone's Still Watching AI Crypto in August
The AI narrative hasn't gone away. What's changed is the momentum underneath it. Most of these tokens rallied hard earlier in 2026, then rolled into descending channels once the broader risk-on mood cooled. Some, like Grass, are still technically inside an uptrend on the daily chart. Others, like io.net and Fetch.ai, are printing fresh oversold readings with no confirmed bounce yet.
That split matters for how you read an "AI crypto forecast for August 2026. "This isn't a single trade. It's eight separate charts, each with its own support level and its own reason for moving. If Bitcoin's own trend shifts, that tends to ripple through this whole basket too, so it's worth keeping an eye on Bitcoin price prediction 2026 coverage alongside these AI-specific setups.
AI Crypto Price Predictions August 2026: Coin by Coin
Bittensor (TAO) Price Prediction
TAO trades near $192-194, and it's the one token here still green on the day. RSI sits mid-range at 42.79 daily and 42.27 weekly.
Technical Analysis
Daily Chart: 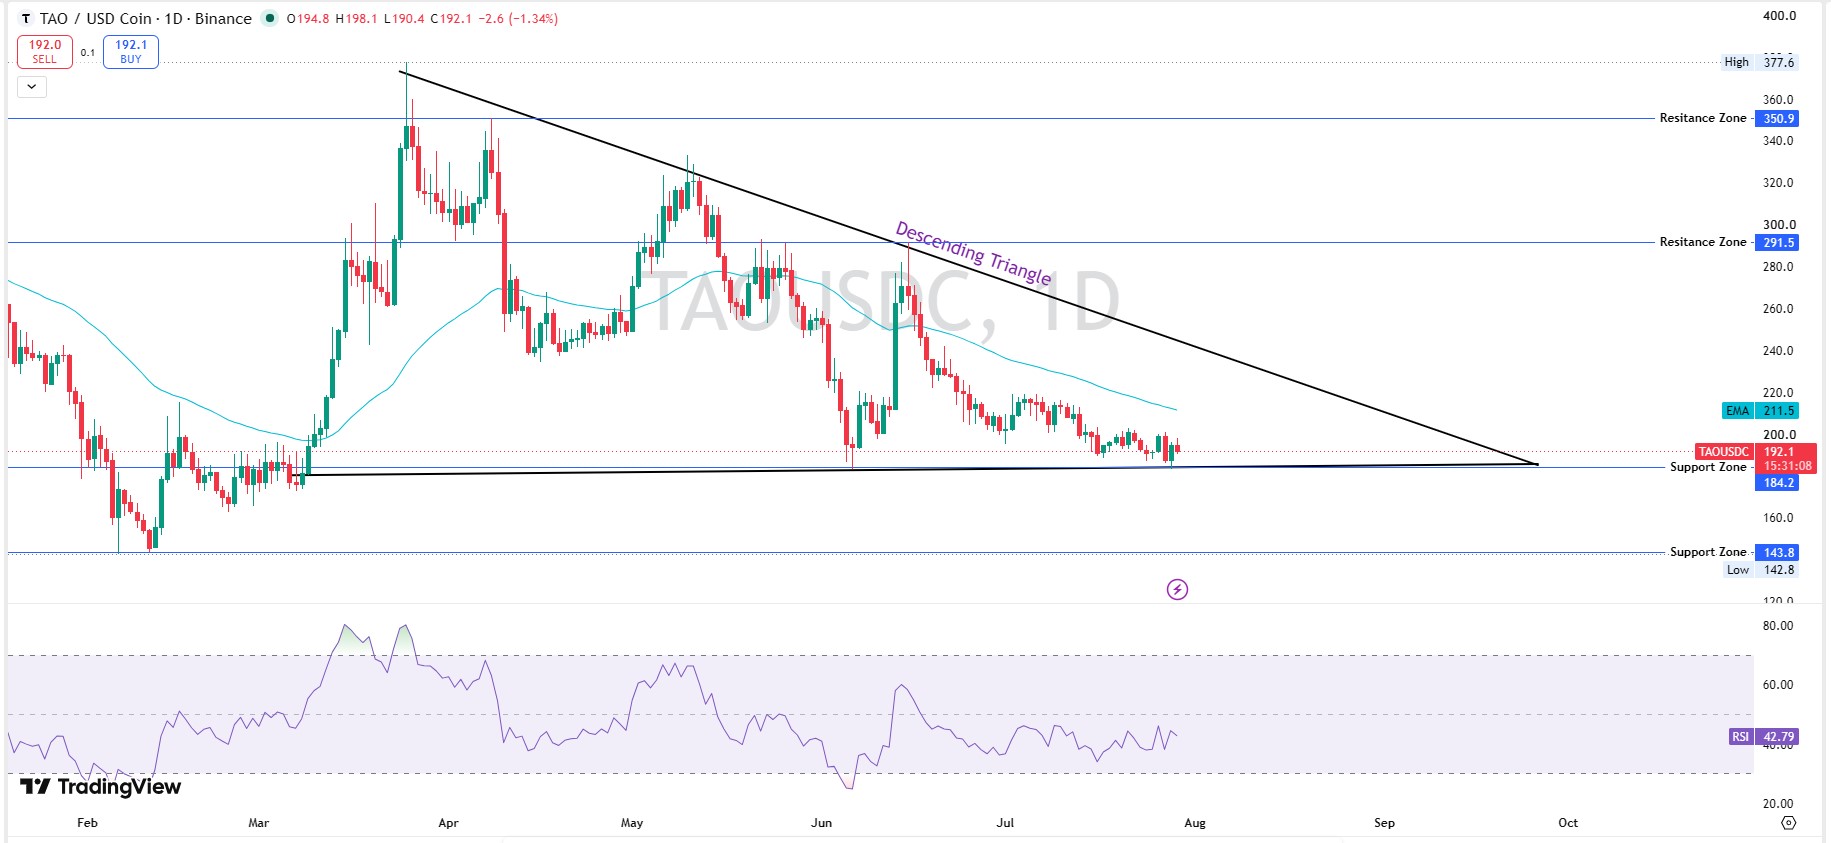
TAO/USDC on the 1D TradingView chart is shaping a descending triangle. Flat horizontal support runs through the $184-192 zone, tested repeatedly since March, while a descending resistance trendline connects back to the April high above $340. Those two lines are converging toward an apex around September-October. The price is currently compressing right above the flat support line, and RSI at 42.79 shows no strong directional bias, consistent with the coiling phase that typically precedes a breakout.
Weekly Chart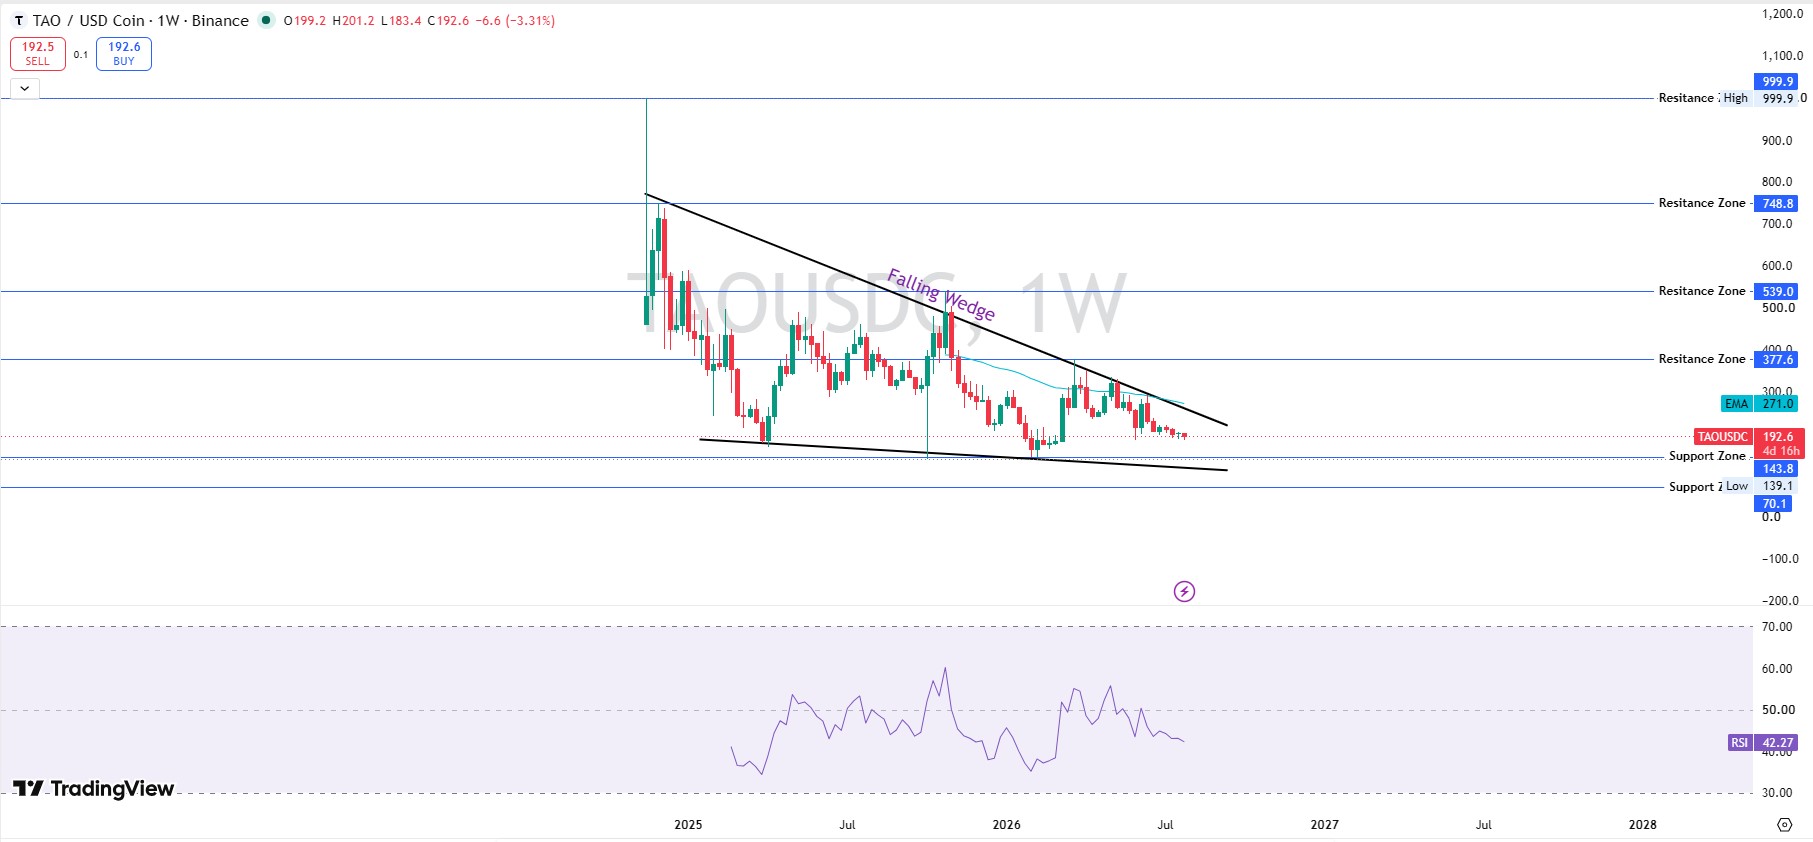
On the 1W chart, that same convergence reappears as a falling wedge: declining resistance from the 2024-25 highs (near $748-$999, with the all-time high at $999.9) against a flatter support band around $139-192 that's been tested multiple times without breaking. Weekly RSI at 42.27 is mid-range. Falling wedges into horizontal, well-tested support are generally read as coiling patterns that favor an eventual upside resolution, but confirmation would require a volume-backed breakout above the descending trendline.
-
Support: $184-190
-
Resistance: $340 (triangle apex resistance, far above current price)
-
Base case: continued sideways coiling between $185 and $210 through August
-
Bull case: a volume breakout above the descending trendline opens room toward $250+
-
Bear case: a close under $184 breaks the flat support and exposes the triangle's lower structure
-
Invalidation: daily close below $184
TAO Overview and Tokenomics
Bittensor is a decentralized machine-learning network that pays TAO to miners and validators for the informational value their models contribute, with staking and delegation central to how influence is distributed across its subnets.
| Metric | Value | Source |
|---|---|---|
| Market Cap | $1.86B–$2.09B (varies by snapshot) | CoinMarketCap |
| FDV | $4.08B–$4.09B | CoinMarketCap |
| MC/FDV | 0.46 | CoinMarketCap |
| Circulating Supply | 9.6M–11.17M TAO (varies by staked-supply treatment) | CoinMarketCap |
| Total / Max Supply | 21,000,000 TAO | CoinMarketCap |
| Turnover | 6.05% | CoinMarketCap |
TAO runs on its own Substrate chain, not a standard EVM or Solana ledger, so the wallet-concentration and Gini-score tooling that Coinglass and SoSoValue apply to the other tokens here isn't consistently available for it. We're not filling that gap with an estimate. For general AI-sector headlines, AI crypto news coverage tracks developments across this basket.
For a closer look at TAO's recent volatility, Bittensor price crash breakdown covers the setup in more detail.
Render (RENDER) Price Prediction
RENDER closed at $1.39-1.40, down roughly 2% on the day and over 6% on the week.
Technical Analysis
Daily Chart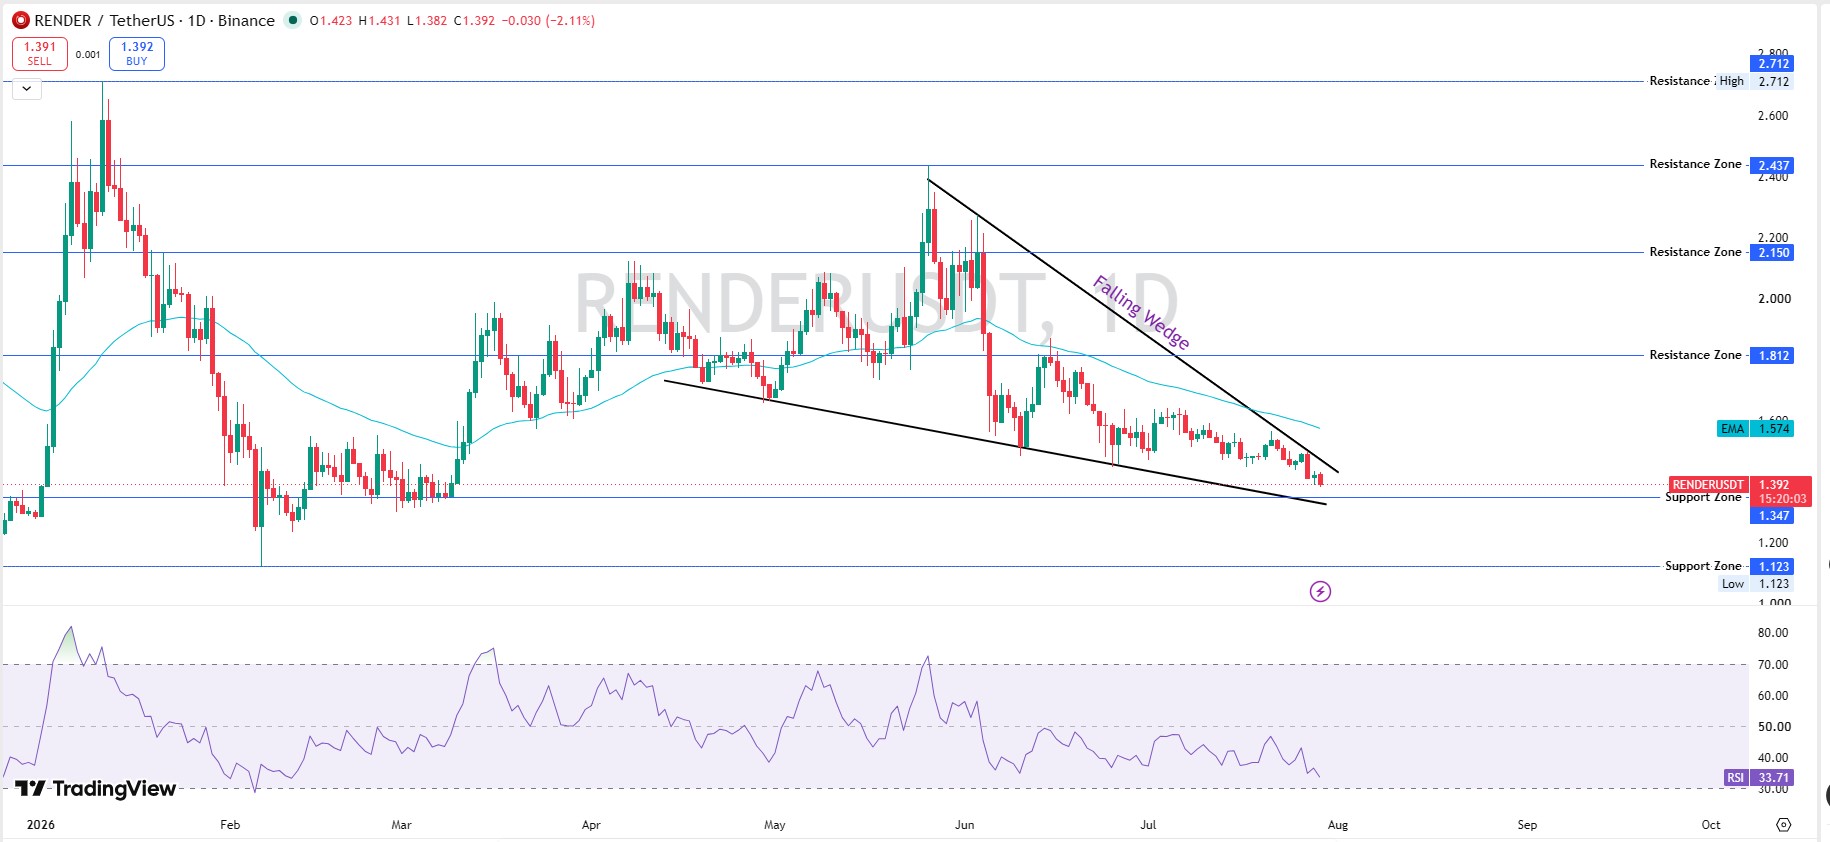
RENDER/USDT on the 1D chart is carving a falling wedge, converging trendlines running from the June high near $2.44 down to the current price, with resistance and support both sloping downward but support declining more slowly. Price is currently testing the lower boundary of the wedge and trading below the EMA at $1.574. The RSI at 33.71 is low and approaching oversold. Falling wedges are typically read as bullish reversal setups once they resolve with a breakout above the upper trendline, but that breakout hasn't happened yet.
Weekly Chart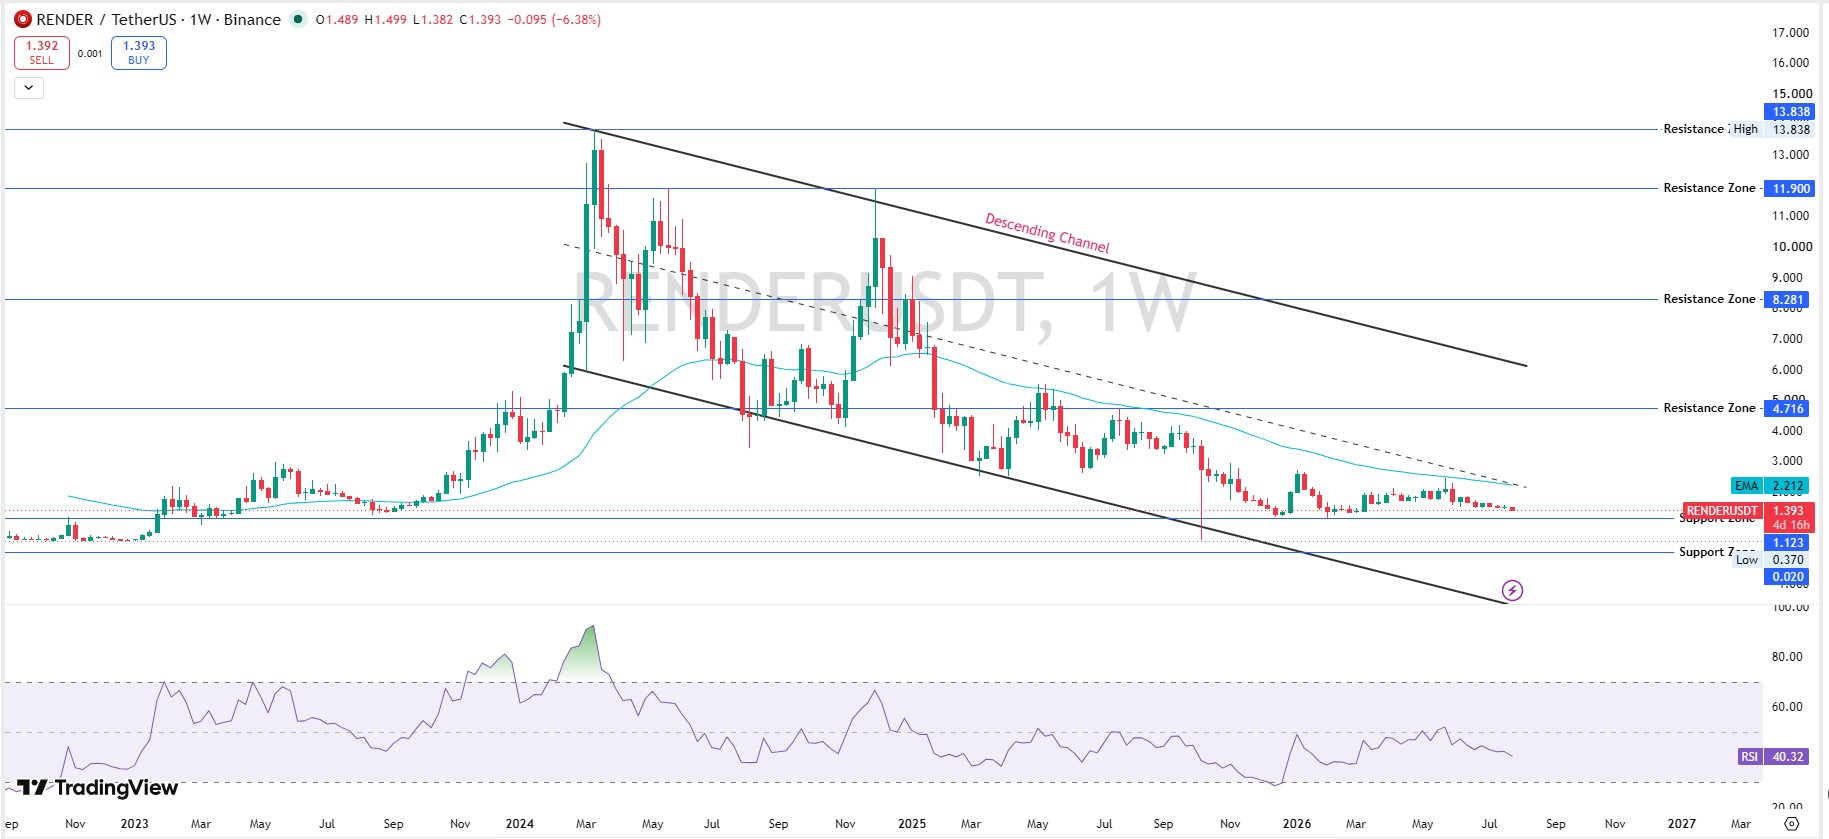
On the 1W chart, the falling wedge gives way to a much larger descending channel dating back to the 2023-24 high near $13.84. RENDER has been in a persistent downtrend for well over a year, trading far below its weekly EMA at $2.212. Weekly RSI at 40.32 is mid-range, cooling off from a bounce that reached the 50s. The price is now pressing against the support zone at $1.123, a level that's held since it was first tested; a break below would open significant downside toward the $0.370 zone.
-
Support: $1.123, deeper zone at $0.370
-
Resistance: $1.574 (EMA), then $2.44
-
Base case: range-bound $1.20-$1.55 while the wedge resolves
-
Bull case: breakout above the wedge's upper trendline targets $1.80+
-
Bear case: loss of the $1.123 support zone opens a path toward $0.37
-
Invalidation: daily close below $1.123
RENDER Overview and Tokenomics
Render is a GPU-compute network that lets creators pay for rendering power sourced from idle GPUs.
| Metric | Value | Source |
|---|---|---|
| Market Cap | $726.28M | CoinMarketCap |
| FDV | $746.95M | CoinMarketCap |
| MC/FDV | 0.97 | CoinMarketCap |
| Circulating Supply | 518,772,101 RENDER | CoinMarketCap |
| Total Supply | 533,532,274 RENDER | CoinMarketCap |
| Max Supply | 644,245,094 RENDER | CoinMarketCap |
| Turnover | 3.2% | CoinMarketCap |
| 24H Volume | $23.23M | CoinMarketCap |
| Holders | 92,619 | SoSoValue |
| Top 100 Concentration | 96% | SoSoValue |
| Whale Concentration | 95.70% | SoSoValue |
| Gini Score | 0.9954 | SoSoValue |
| Top Holder | Wormhole Token Bridge, 84.31% ($629.7M) | SoSoValue |
That top-holder figure reflects bridged/wrapped token custody through Wormhole, not one entity privately controlling 84% of RENDER, an important distinction before reading this as classic whale risk. You can verify wallet-level balances directly on RENDER's Etherscan contract page.
More context on RENDER's rally potential is in Render $15 rally analysis.
Fetch.ai (FET) Price Prediction
FET is the roughest chart in the set this week. Price closed near $0.133, down 16.33% on the weekly candle. That's a brutal print.
Technical Analysis
Daily Chart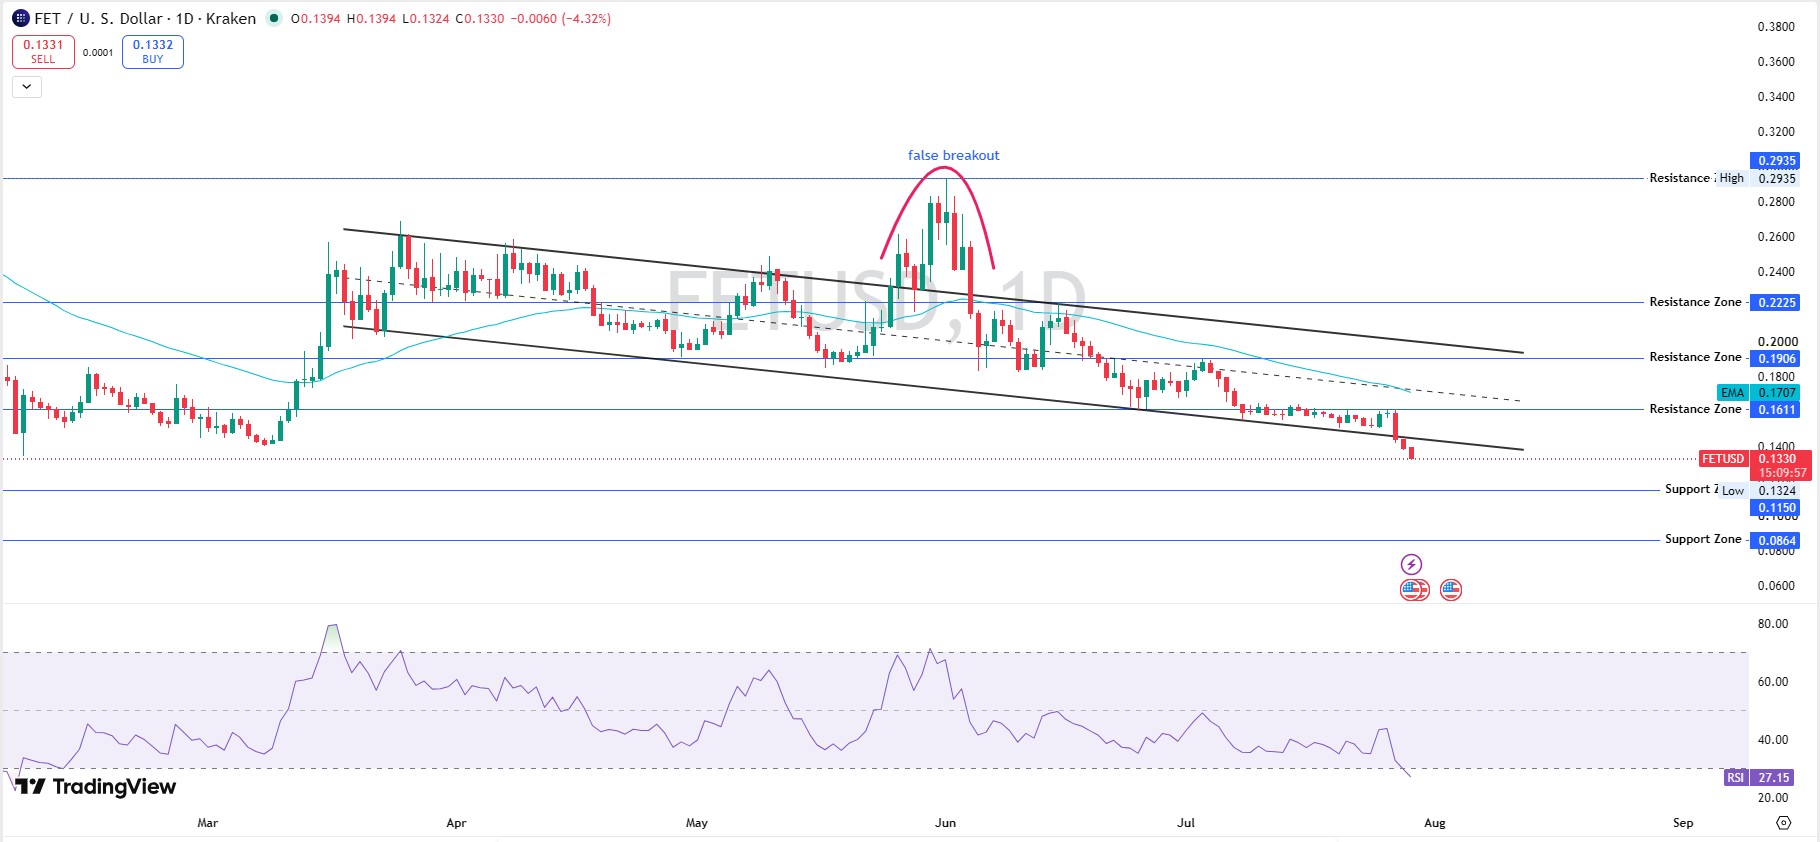
FET/USD on the 1D chart shows a descending channel with a confirmed false breakout in early June: price rallied to $0.29, tagging the upper channel trendline, before reversing hard, a textbook bull trap. Since that rejection, price has ground steadily lower and has now broken decisively below the lower boundary of the descending channel on a large red candle, trading well under the EMA at $0.1707. The RSI at 27.15 is deep in oversold territory, approaching washout levels, which suggests the move down is stretched and could be due for at least a technical bounce, though no reversal signal has confirmed yet.
Weekly Chart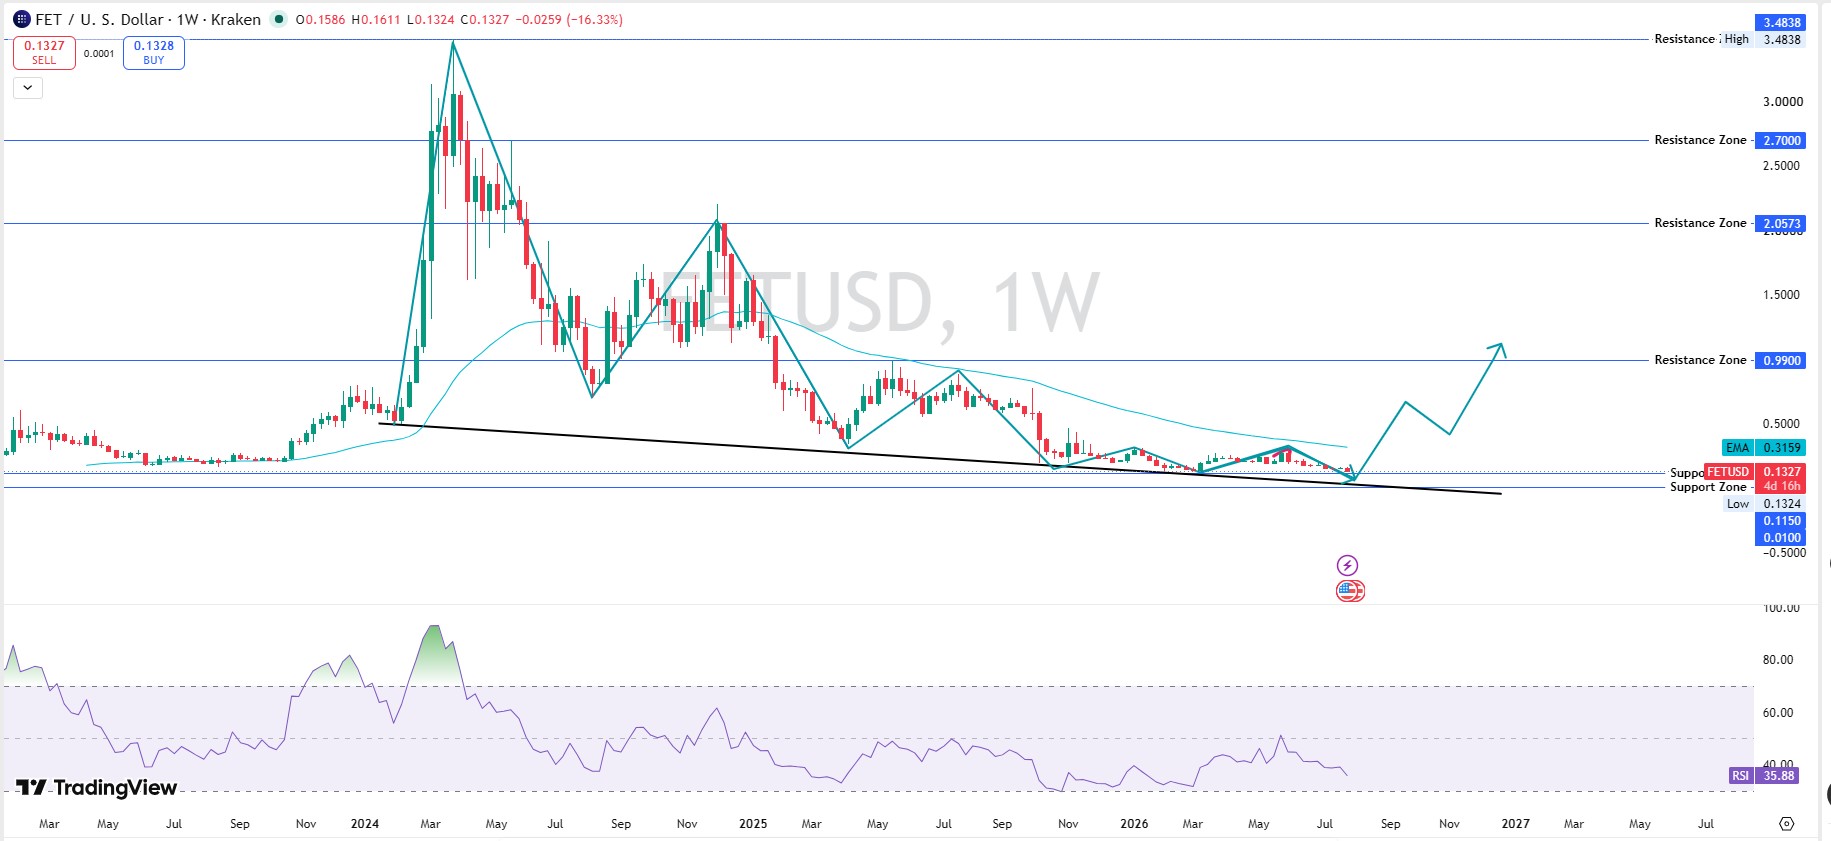
The weekly close of $0.1327 is the most damaging chart in this basket. FET has fallen from an all-time high near $3.48 (2023-24) through a series of lower highs, the last major peak near $2.05 in late 2024, into a long, grinding downtrend. Price is now testing a long-term ascending trendline drawn from the 2023 base through successive higher lows, arguably the last structural support line before price is in genuinely uncharted territory relative to this trend. Weekly RSI at 35.88 is below neutral and declining. There's a projection zone marked toward $0.99 resistance if the trendline holds, but that's a scenario marker, not a confirmed signal; the current price is sitting right on the make-or-break line.
-
Support: the weekly ascending trendline, roughly current price
-
Resistance: $0.1707 (EMA), then $0.99 (long-range projection zone, not a near-term target)
-
Base case: a relief bounce toward $0.15-$0.17 if the weekly trendline holds
-
Bull case: trendline holds and volume returns, opening a slower climb back toward $0.20+
-
Bear case: weekly close below the ascending trendline confirms a breakdown with no nearby support
-
Invalidation: weekly close below the multi-year ascending trendline
FET Overview and Tokenomics
Fetch.ai is part of the Artificial Superintelligence Alliance, positioning FET as the token behind autonomous agent infrastructure.
| Metric | Value | Source |
|---|---|---|
| Market Cap | $298.19M | CoinMarketCap |
| FDV | $361.28M | CoinMarketCap |
| MC/FDV | 0.83 | CoinMarketCap |
| Circulating Supply | 2,240,357,549 FET | CoinMarketCap |
| Max Supply | 2,714,384,546 FET | CoinMarketCap |
| Turnover | 22.54% | CoinMarketCap |
| 24H Volume | $67.2M | CoinMarketCap |
| Holders | 169,532 | SoSoValue |
| Top 100 Concentration | 84.93% | SoSoValue |
| Whale Concentration | 88.04% (166 whale wallets) | SoSoValue |
| Top Holders | Largest Wallet: 10.52% ($37.8M) Second Largest Wallet: 10.23% | SoSoValue |
Concentration risk here is spread across a handful of large holders rather than sitting in a single dominant wallet, a breakdown you can cross-check on FET's Etherscan contract page.
For how the broader smart-contract majors are trending alongside FET, see Ethereum price prediction 2026 coverage.
NEAR Protocol Price Prediction
NEAR closed the week at $1.59-1.60, down over 13%. This is a structural breakdown.
Technical Analysis
Weekly Chart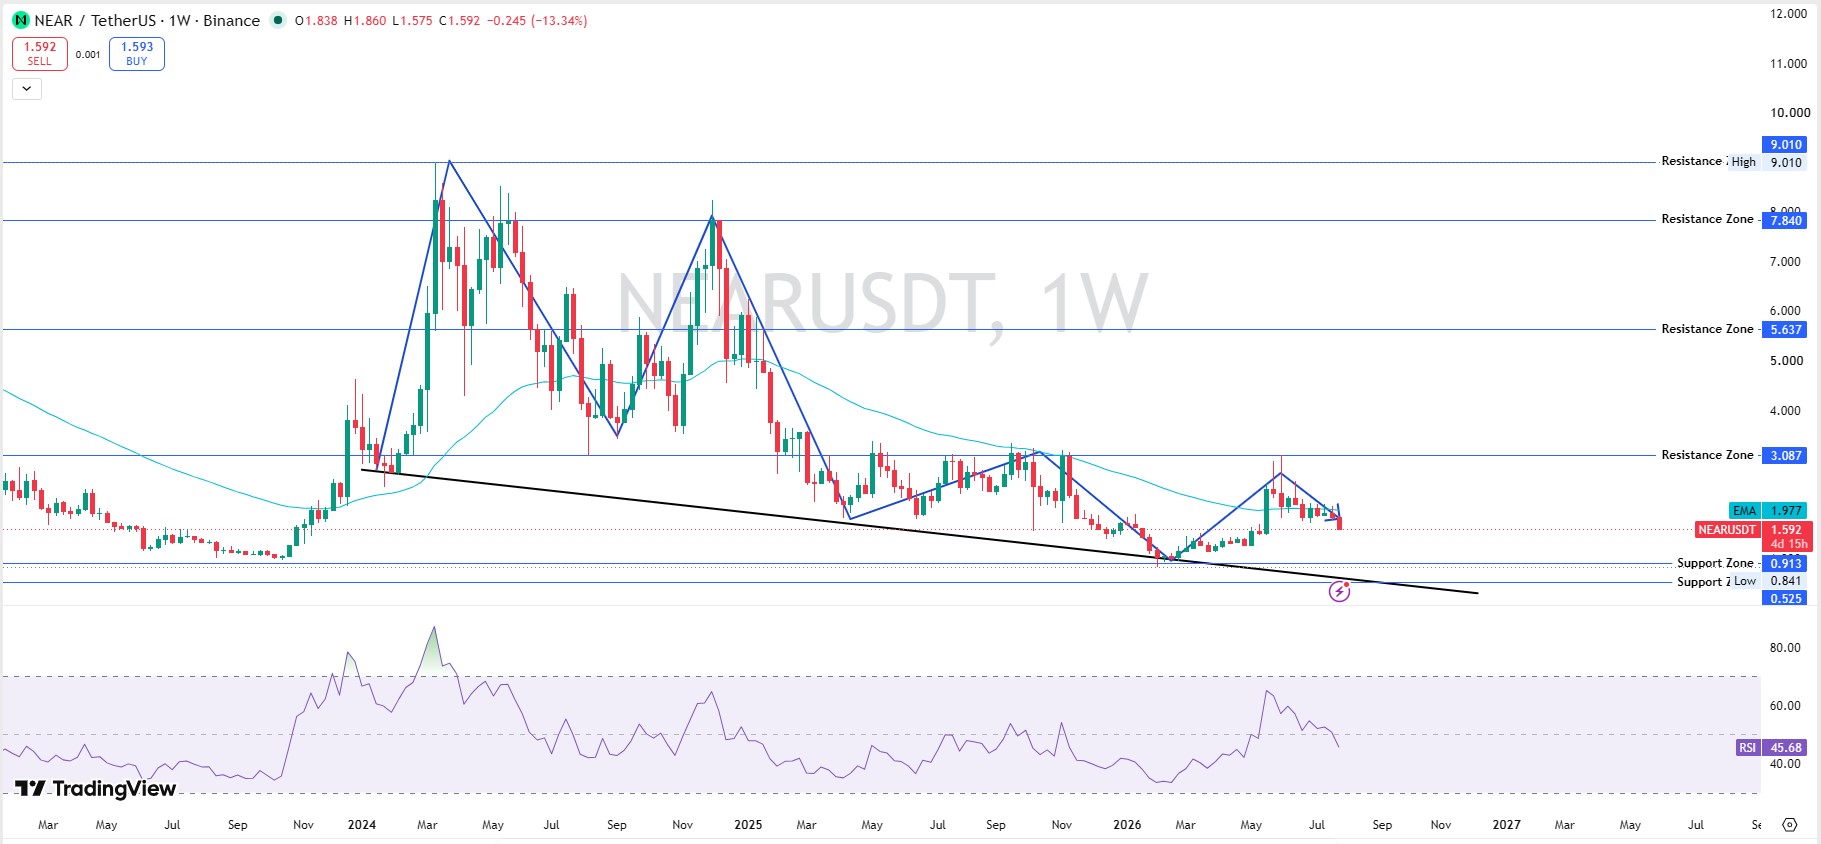
NEAR/USDT on the 1W chart shows a long-term descending trendline connecting two major swing highs: a peak near $9.01 in early 2024 and a secondary, lower peak near $8.00 in late 2024, a classic lower-high sequence. Since then, price has carved a series of smaller higher-low swings, a rising support structure that had been building since the 2026 low. This week's sharp drop broke below that rising trendline right near the apex, where it converges with the longer descending resistance line, effectively a breakdown from a large symmetrical/descending wedge. RSI at 45.68 is below neutral and falling from a recent bounce near 60, confirming the loss of near-term momentum. The next visible support sits at $0.913, well below the current price.
-
Support: next visible level is $0.913
-
Resistance: the broken trendline now acts as resistance, roughly $1.80-$2.00
-
Base case: consolidation between $1.40 and $1.70 as the market digests the breakdown
-
Bull case: a reclaim of the broken trendline would question the bearish read
-
Bear case: continuation toward $0.913 if selling persists
-
Invalidation: weekly close back above the broken trendline
NEAR Overview and Tokenomics
NEAR Protocol is a sharded, developer-focused layer-1 built around low fees and fast finality.
| Metric | Value | Source |
|---|---|---|
| Market Cap | $2.08B | CoinMarketCap |
| FDV | $2.08B | CoinMarketCap |
| MC/FDV | 1.00 | CoinMarketCap |
| Circulating Supply | 1,302,144,645 NEAR | CoinMarketCap |
| Total Supply | 1,302,144,654 NEAR | CoinMarketCap |
| Turnover | 8.72% | CoinMarketCap |
| 24H Volume | $181.6M | CoinMarketCap |
| Total Transactions | 5.4 billion | NearBlocks |
| Throughput | 6 TPS | NearBlocks |
| Active Validators | 413 | NearBlocks |
| Avg Block Time | 0.61 seconds | NearBlocks |
| Gas Cost | 0.0001 per TGas | NearBlocks |
NEAR doesn't have the same whale-concentration or Gini-style breakdown SoSoValue provides for the smaller tokens here, so network-usage metrics from NearBlocks' explorer stand in as the fundamentals check instead.
NEAR key levels breakdown covers this trendline break in more depth.
NEAR's network activity (5.4B total transactions, 413 active validators, per NearBlocks) is a fundamental bright spot even as price cools; more in NEAR whale activity coverage.
Grass (GRASS) Price Prediction
GRASS is the one chart here still inside an uptrend on the daily timeframe. The price closed at $0.319-0.320.
Technical Analysis
Daily Chart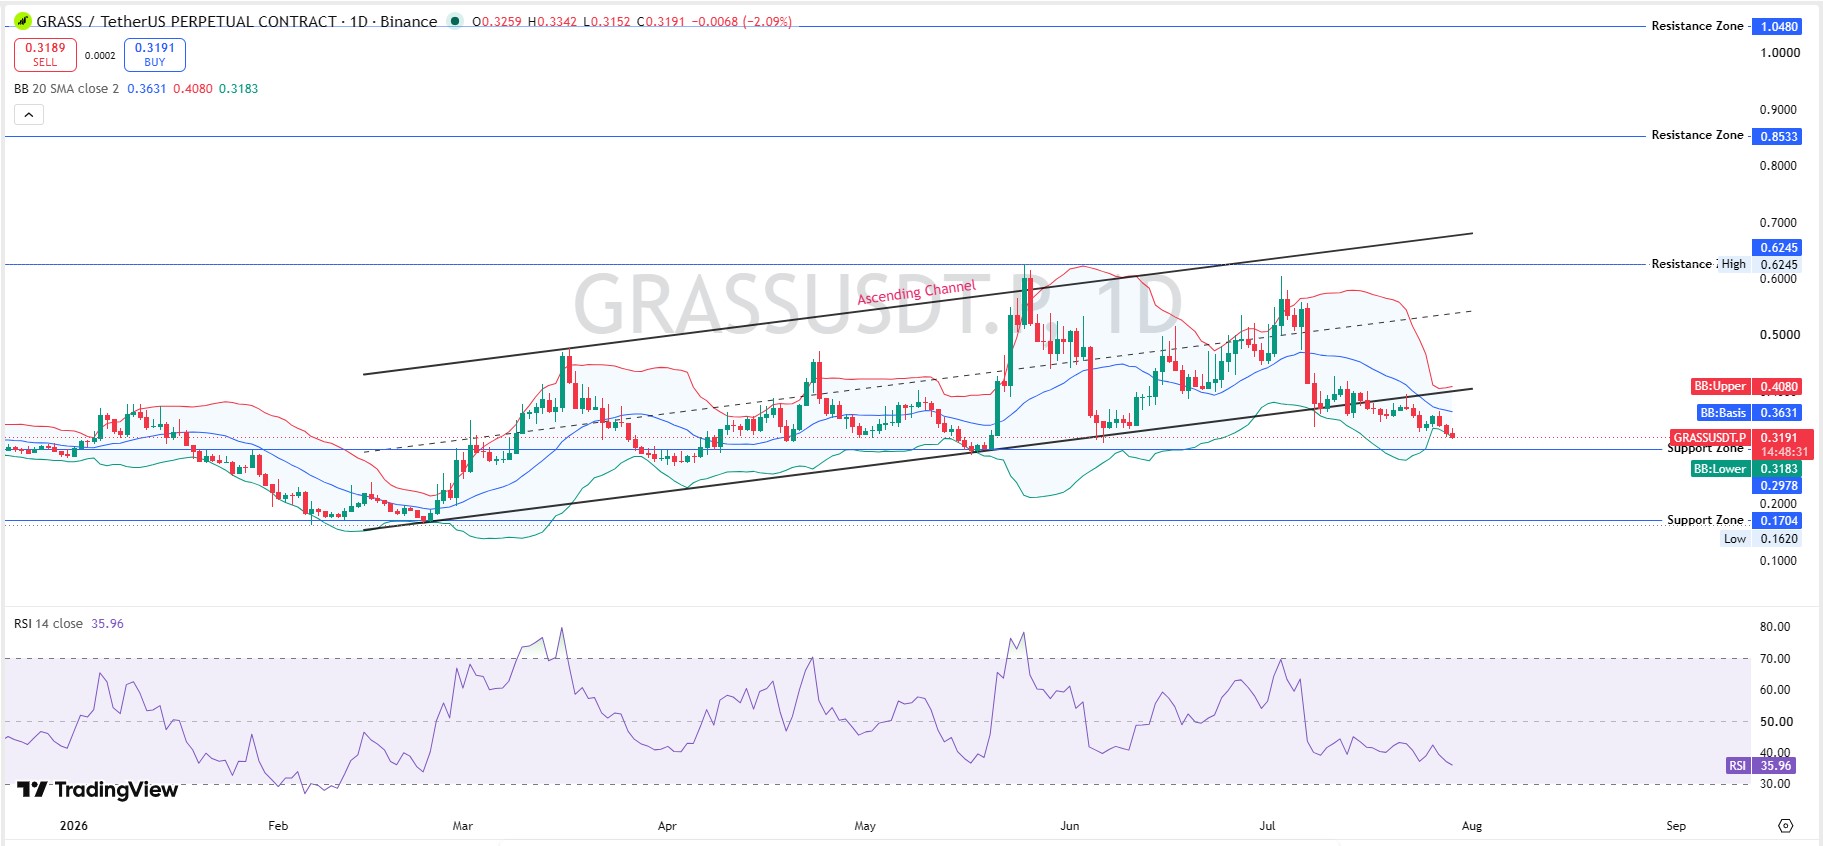
GRASS/USDT on the 1D chart shows an ascending channel, higher highs, and higher lows since the February low near the support zone at $0.1620-0.1704. The rally accelerated through May-June, peaking near $0.52 in early July (tagging the Resistance High near $0.6245) before pulling back. The price is now sitting right at the lower boundary of the ascending channel and testing the BB lower band at $0.3183 at the same time, a confluence zone worth watching. RSI at 35.96 has cooled sharply from an overbought reading near 78 in June and now sits below neutral. This is a pullback within an intact uptrend so far, but a break of the channel's lower trendline would invalidate the bullish structure.
Weekly Chart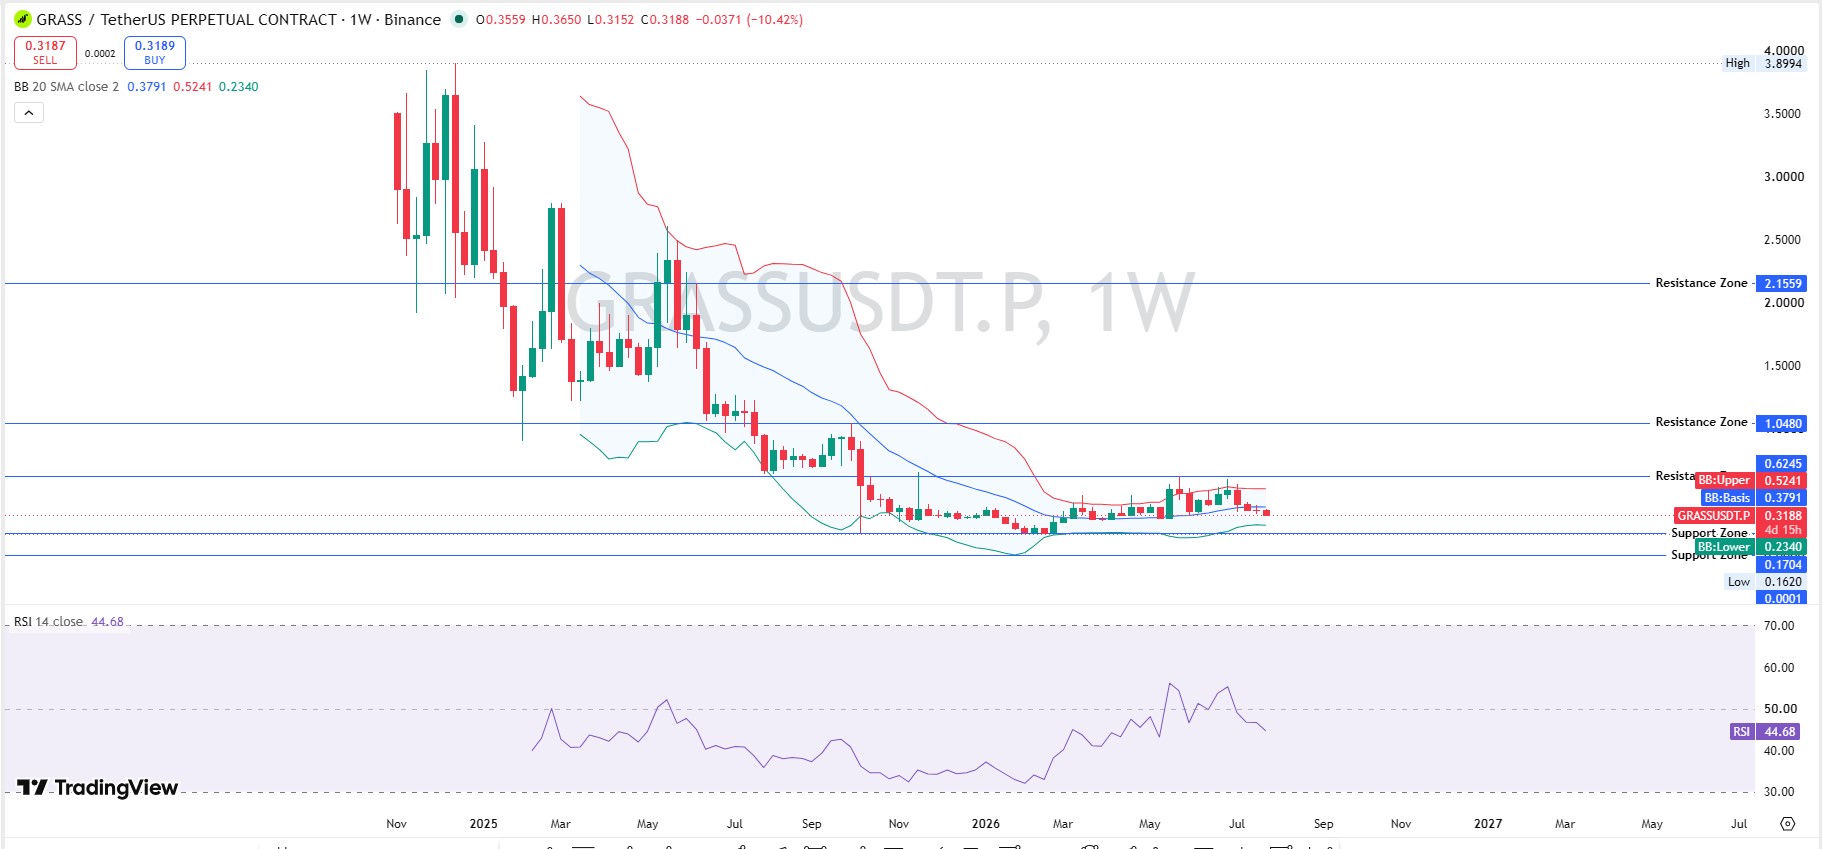
Zoomed out, the picture changes. GRASS collapsed from an all-time high near $3.90 in late 2024 down to a base around $0.16-$0.30 that's held since roughly March 2026. What looks like a daily ascending channel is, in the weekly context, a recovery and basing rally off a multi-month low, not yet a reversal of the larger downtrend. Weekly RSI at 44.68 is mid-range, having recently peaked near 58 before cooling, consistent with accumulation-phase behavior rather than a full trend change.
-
Support: $0.1620-$0.1704 (channel low), BB lower band at $0.3183 near-term
-
Resistance: $0.52, then $0.6245
-
Base case: holds the ascending channel, chops between $0.30 and $0.38
-
Bull case: channel holds and price retests $0.52
-
Bear case: break of the ascending channel's lower trendline invalidates the near-term uptrend
-
Invalidation: daily close below $0.3183
GRASS Overview and Tokenomics
Grass pays users for sharing spare internet bandwidth to help train AI models.
| Metric | Value | Source |
|---|---|---|
| Market Cap | $209.2M | CoinMarketCap |
| FDV | $319.6M | CoinMarketCap |
| MC/FDV | 0.65 | CoinMarketCap |
| Circulating Supply | 654,552,795 GRASS | CoinMarketCap |
| Max Supply | 1,000,000,000 GRASS | CoinMarketCap |
| Turnover | 7.29% | CoinMarketCap |
| 24H Volume | $15.3M | CoinMarketCap |
| Holders | 328,768 | SoSoValue |
| Top 10 Concentration | 53.82% ($172.41M) | SoSoValue |
| Whale Concentration | 83.12% | SoSoValue |
| Top Holder | Grass Multisig (Treasury), 25.95% ($83.1M) | SoSoValue |
GRASS price has the widest holder base of any token in this basket, though concentration among the top 10 wallets is still meaningful. The largest wallet is a labeled protocol-treasury address, not an anonymous whale, and its balance is visible directly on GRASS's Solscan token page.
io.net (IO) Price Prediction
IO closed near $0.133, down 4.6% daily and over 11% weekly.
Technical Analysis
Daily Chart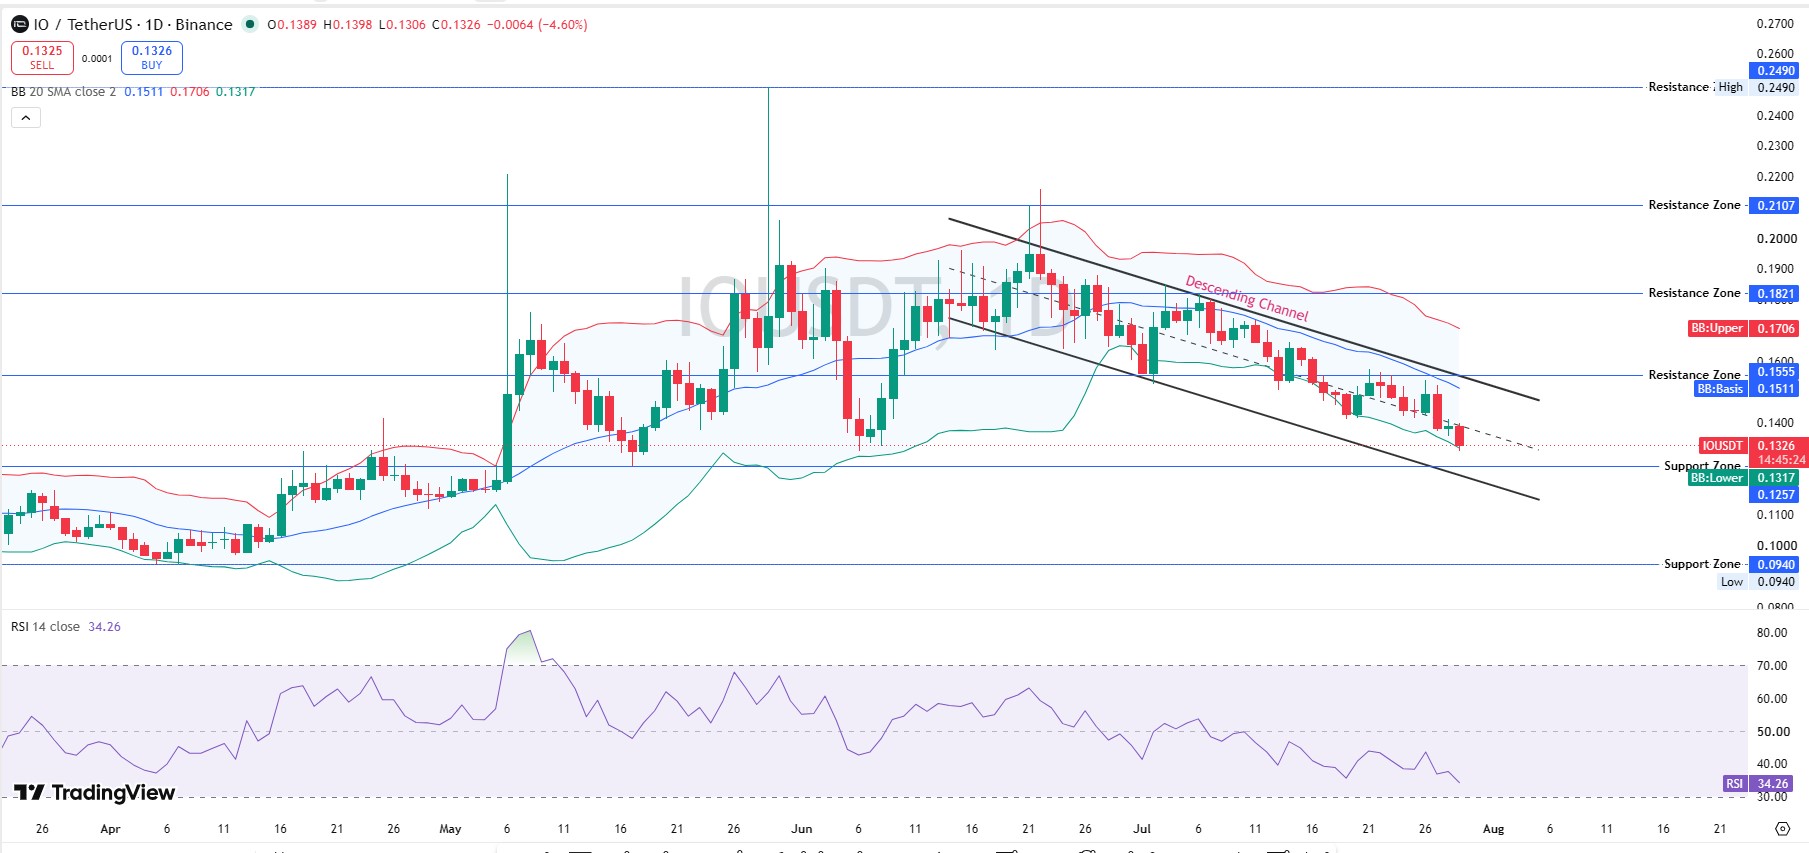
IO/USDT on the 1D chart shows a descending channel originating from the June high near $0.21 (resistance zone $0.2107). The move down was steady and orderly until the most recent session, when price broke below both the channel's lower trendline and the Bollinger lower band at $0.1317 with increased downside momentum. RSI at 34.26 is falling and approaching oversold, with no confirmed bounce signal yet.
Weekly Chart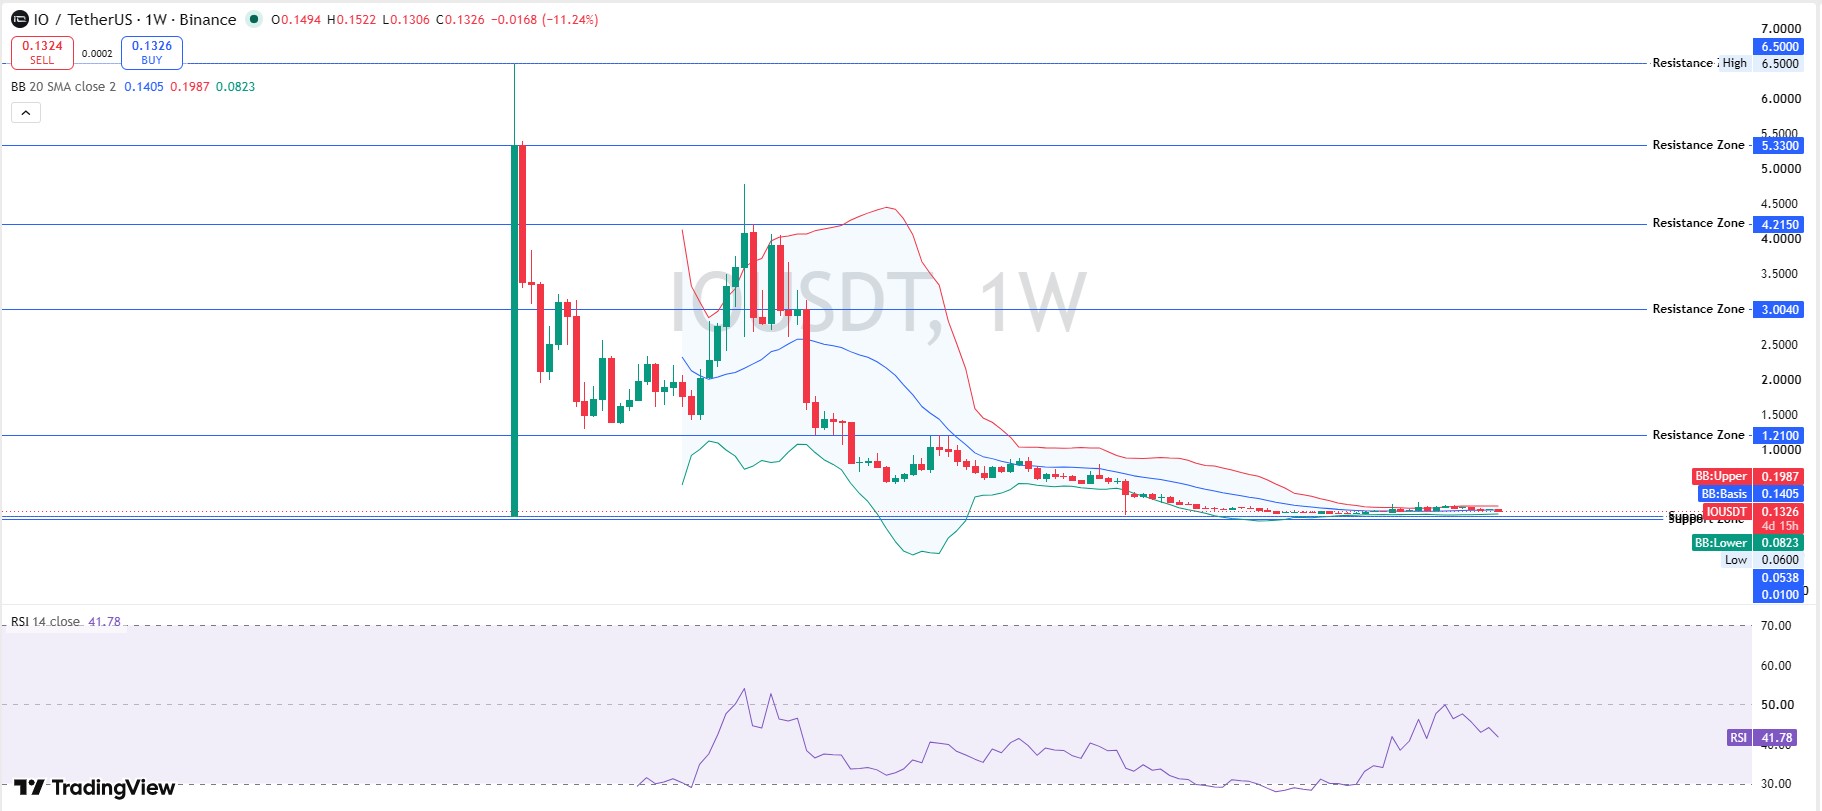
The weekly close of $0.1326 tells the real story of IO's trajectory: a massive spike near launch to over $5 (visible as an extreme outlier candle), followed by a near-continuous, unbroken bleed down to the current $0.13 level, where price has now flatlined for several months. There's essentially no meaningful chart structure, no channels or wedges, at this timeframe, just a decayed, exhausted downtrend. Weekly RSI at 41.78 is mid-range and has actually been drifting up slightly off multi-month lows, which suggests the selling pressure is at least stabilizing even if not yet reversing.
-
Support: current zone, roughly $0.125-$0.130, with no strong structural floor visible below
-
Resistance: $0.1707, then $0.21
-
Base case: continued flatlining between $0.12 and $0.15
-
Bull case: weekly RSI uptick turns into a base-building bounce toward $0.17
-
Bear case: flatline breaks lower with no visible support
-
Invalidation: daily close below $0.125
IO Overview and Tokenomics
io.net aggregates idle GPUs into a decentralized compute network aimed at AI workloads.
| Metric | Value | Source |
|---|---|---|
| Market Cap | $48.61M | CoinMarketCap |
| FDV | $106.24M | CoinMarketCap |
| MC/FDV | 0.46 (lowest in this basket) | CoinMarketCap |
| Circulating Supply | 365,523,456 IO | CoinMarketCap |
| Max Supply | 800,000,000 IO | CoinMarketCap |
| Turnover | 14.31% | CoinMarketCap |
| 24H Volume | $6.96M (down 50%+ on the day) | CoinMarketCap |
| Holders | 85,538 | SoSoValue |
| Top 10 Concentration | 58.84% ($62.72M) | SoSoValue |
| Whale Concentration | 71.7% | SoSoValue |
| Top Holder | "Ocean Foundation" Squad Vault, 28.3% ($30M) | SoSoValue |
The sharp drop in 24H volume alongside high turnover is a liquidity flag worth watching. The top wallet is a labeled foundation/treasury vault, not a private wallet, and holder balances can be checked on io.net's Solscan page.
For the latest exchange listing activity across this basket, see crypto exchange listing tracker.
Akash Network (AKT) Price Prediction
AKT closed near $0.429-0.430, down about 3.7% daily and nearly 10% weekly.
Technical Analysis
Daily Chart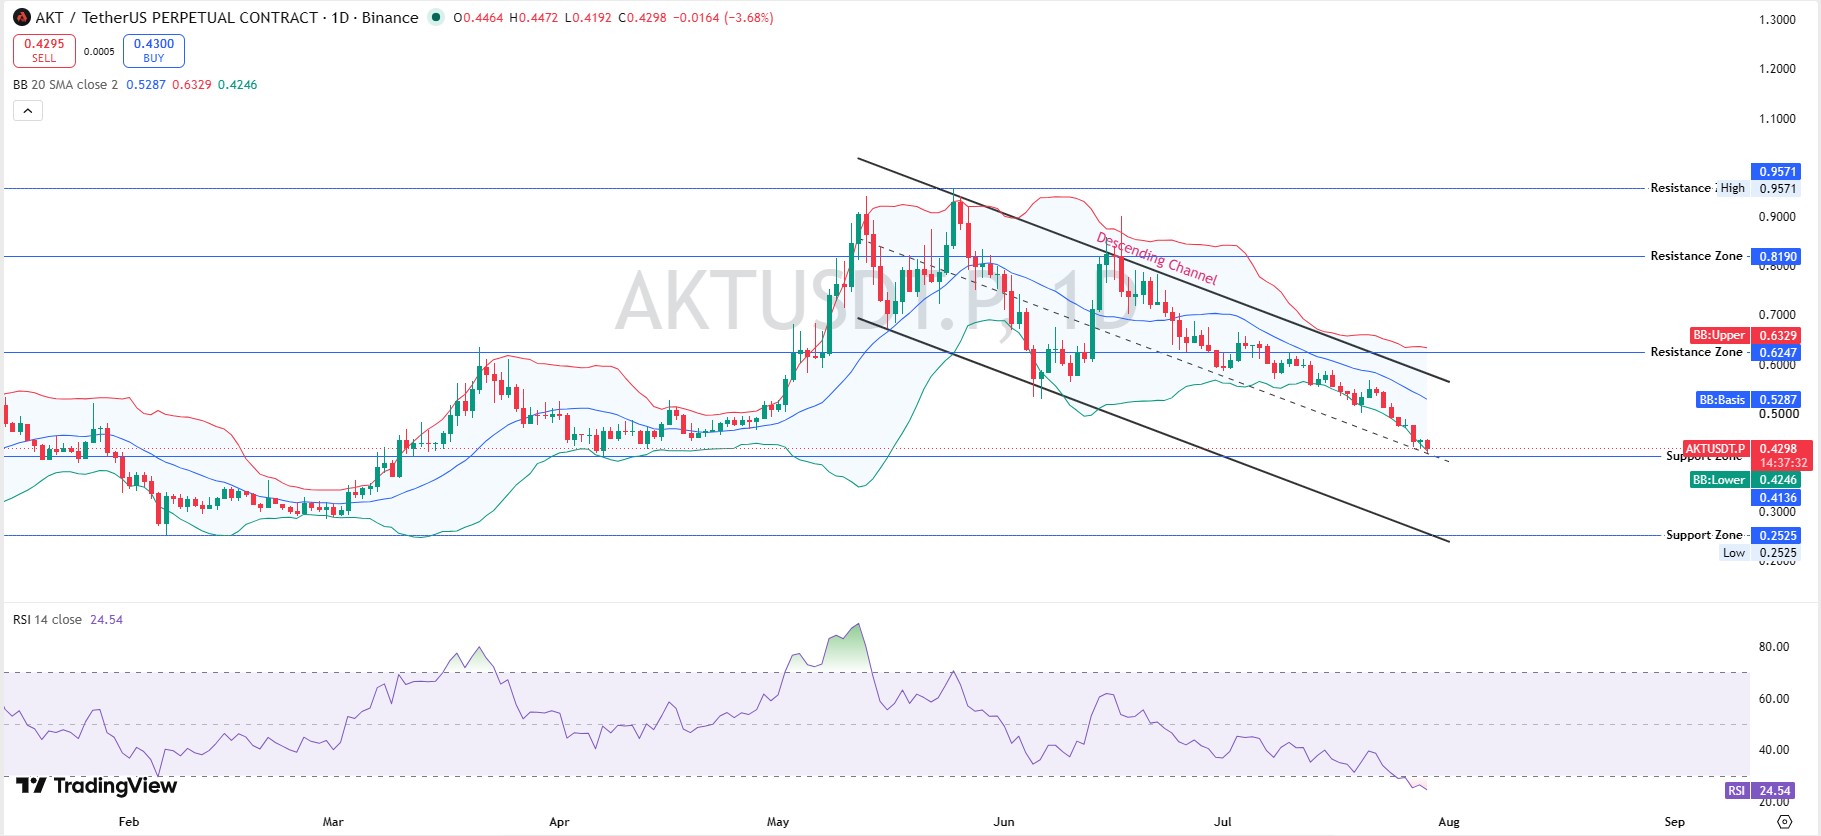
AKT/USDT on the 1D chart is inside a well-defined descending channel that began forming from the May 2026 swing high near $0.95-0.96. Price rallied sharply from February lows ($0.27) into May, tagged the resistance high at $0.9571, then rejected hard and has been making consistently lower highs and lower lows since. The price is currently trading below the Bollinger Band basis at $0.5287 and has pushed through the BB lower band at $0.4246, signaling an oversold extension rather than a controlled pullback. RSI at 24.54 is the lowest reading on the entire chart, confirming aggressive selling pressure, and there's no bullish divergence forming yet since price and RSI are making fresh lows together.
Weekly Chart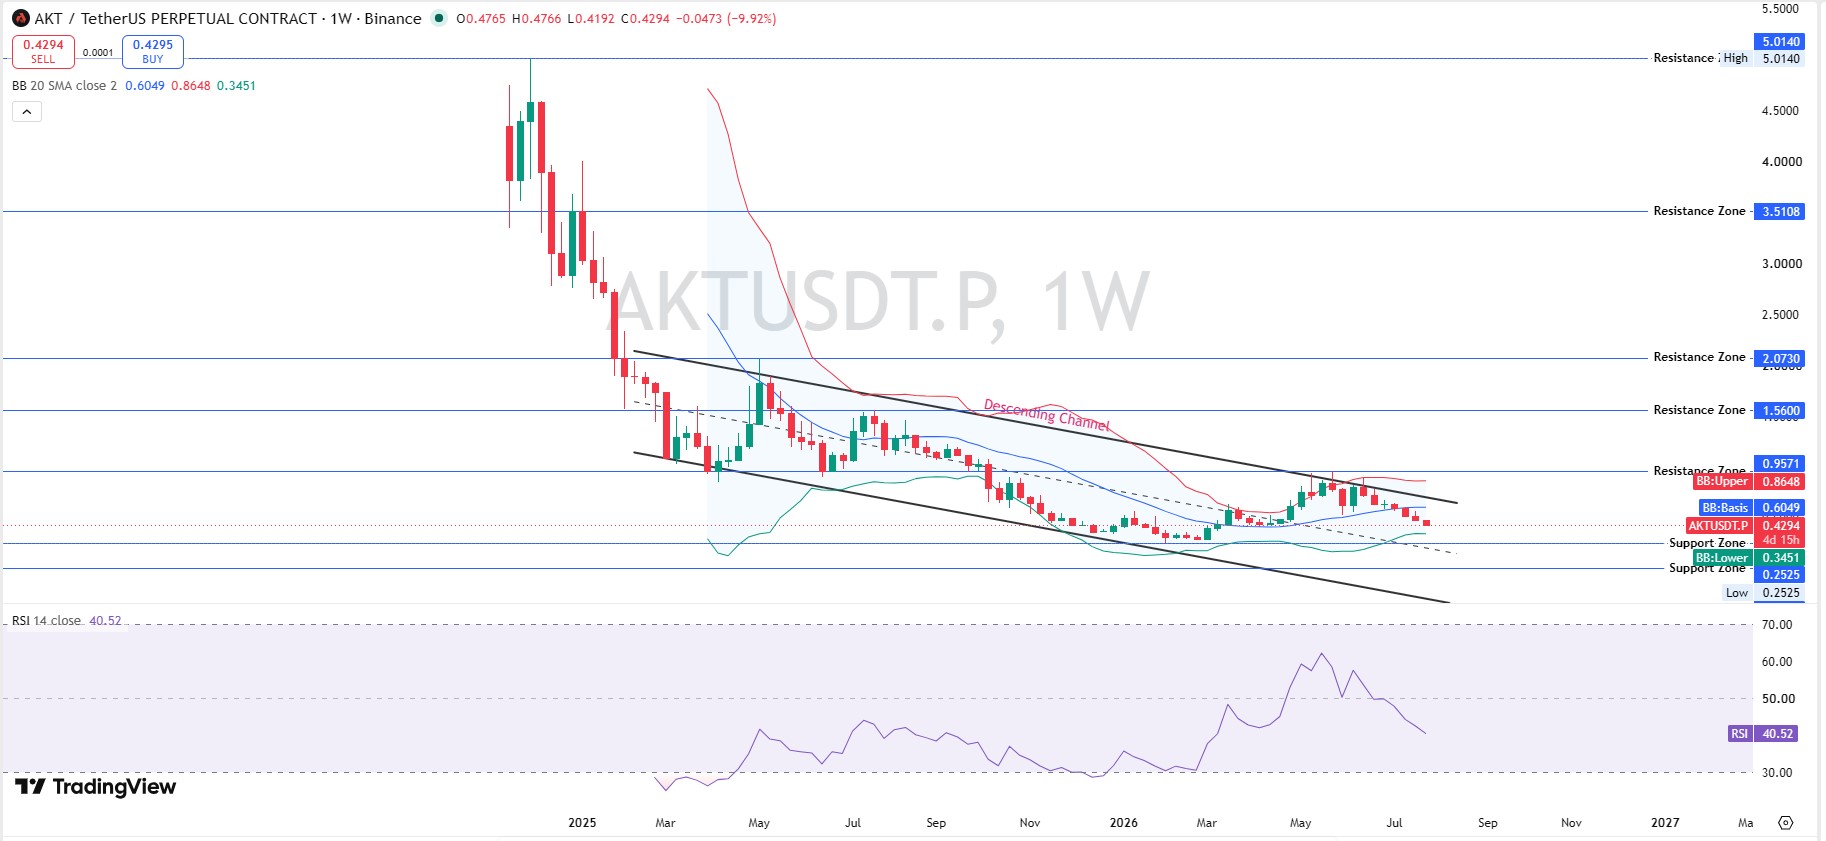
Zooming out, the weekly candle is a large red bar, confirming the daily move isn't an isolated event. The same descending channel structure appears at scale here, stretching back to the all-time high near $5.01 from early 2025. Price has spent over a year grinding lower inside this channel, with each rally capped by declining resistance. The weekly RSI at 40.52 is below neutral but not yet at extreme oversold, having recently cooled off from a bounce that touched near 60 in May/June 2026. Price is now testing the lower boundary of the multi-year channel and the BB lower band at $0.3451, a key structural level; a decisive weekly close below could open room toward the $0.2525 support zone.
-
Support: $0.40-$0.42 near-term, $0.2525 broader floor
-
Resistance: $0.5287 (BB basis), then $0.96
-
Base case: oversold bounce attempt toward $0.47-$0.50
-
Bull case: the reclamation of $0.53 shifts short-term structure
-
Bear case: weekly close below the channel's lower boundary opens room toward $0.2525
-
Invalidation: weekly close below $0.3451 (BB lower band)
AKT Overview and Tokenomics
Akash Network is a decentralized cloud-compute marketplace, increasingly positioned around GPU rental for AI workloads.
| Metric | Value | Source |
|---|---|---|
| Market Cap | $125.30M | CoinMarketCap |
| FDV | $127.09M | CoinMarketCap |
| MC/FDV | 0.99 (nearly fully circulating) | CoinMarketCap |
| Circulating Supply | 292,078,878 AKT | CoinMarketCap |
| Max Supply | 388,539,008 AKT | CoinMarketCap |
| Turnover | 3.01% | CoinMarketCap |
| 24H Volume | $3.77M | CoinMarketCap |
| Tracked IBC Position | 3,299,858 AKT ($1.42M) bridged to Osmosis: 92.62% general holdings, 7.29% module allocations | SoSoValue |
That IBC position is one specific tracked balance, not a full wallet-concentration study, so it shouldn't be read as representative of AKT's overall holder distribution. You can view that bridged position directly on Mintscan's Osmosis asset page.
Virtuals Protocol (VIRTUAL) Price Prediction
VIRTUAL is the calmest chart in the group, down just 0.5-0.7% daily.
Technical Analysis
Daily Chart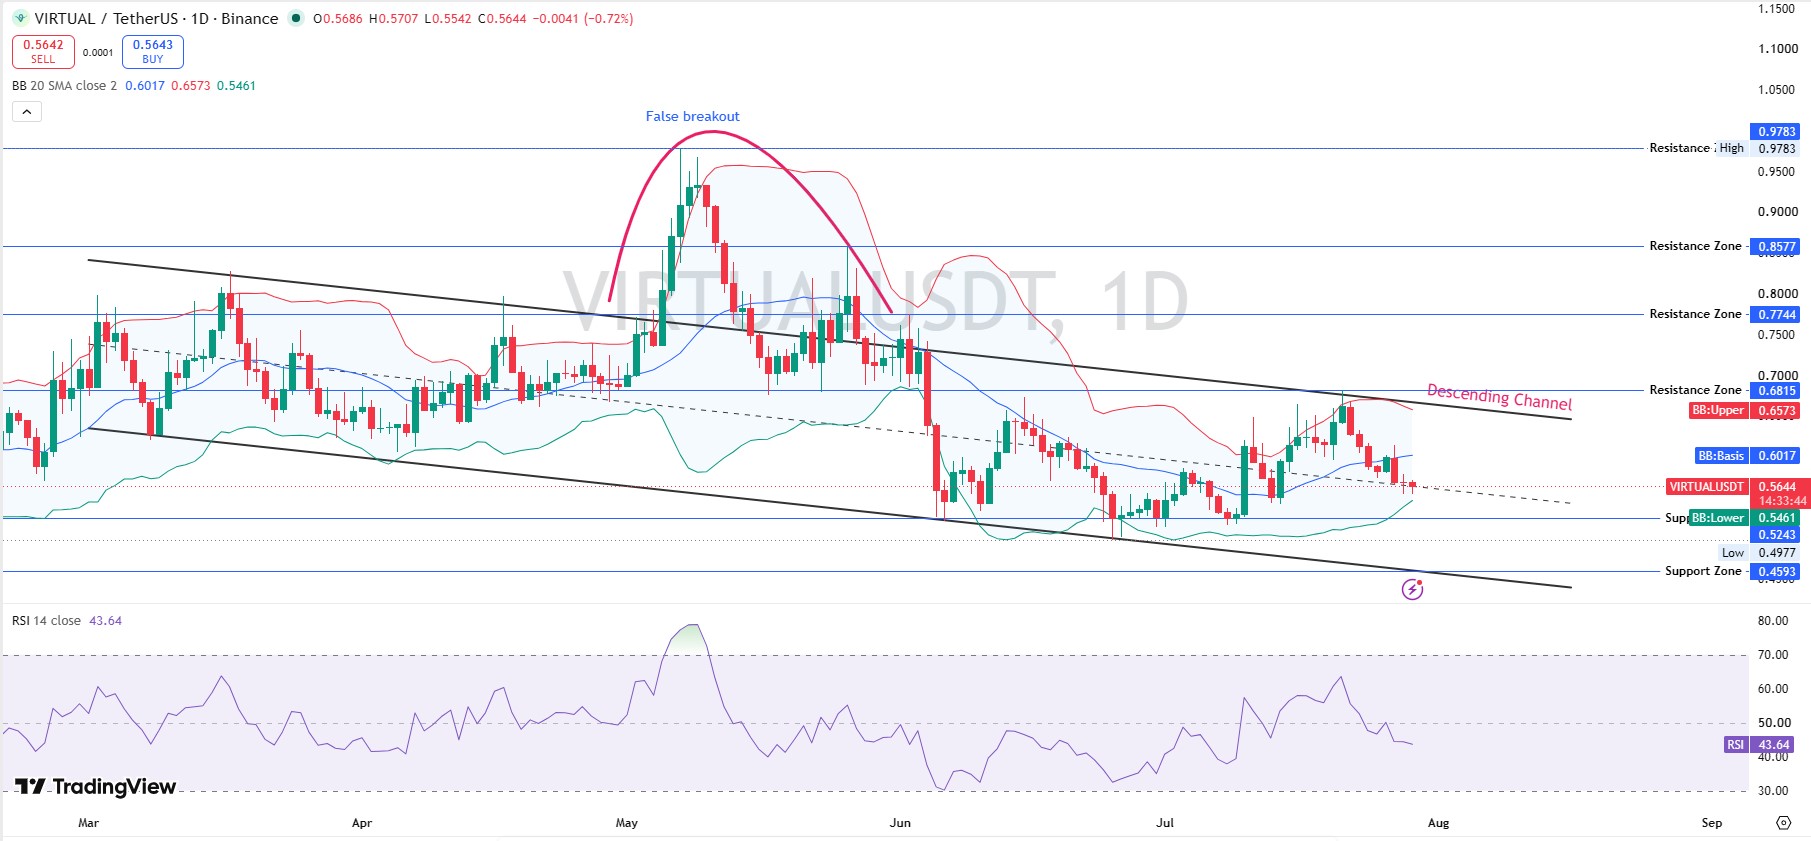
VIRTUAL/USDT on the 1D chart shows a descending channel with a labeled false breakout near late May; price rallied to challenge the $0.95-$0.98 area, briefly popped above short-term resistance, then rolled over hard back into the channel. Since then, price has been oscillating inside the channel, with a recent minor bounce attempt stalling right at the resistance zone ($0.6815) and upper channel trendline, and is now pulling back toward the BB lower band at $0.5461 and mid-channel support. RSI at 43.64 is mid-range, cooled from a peak near 70 during the earlier June bounce attempt, a mildly bearish tell since upside momentum is fading on each subsequent rally attempt.
Weekly Chart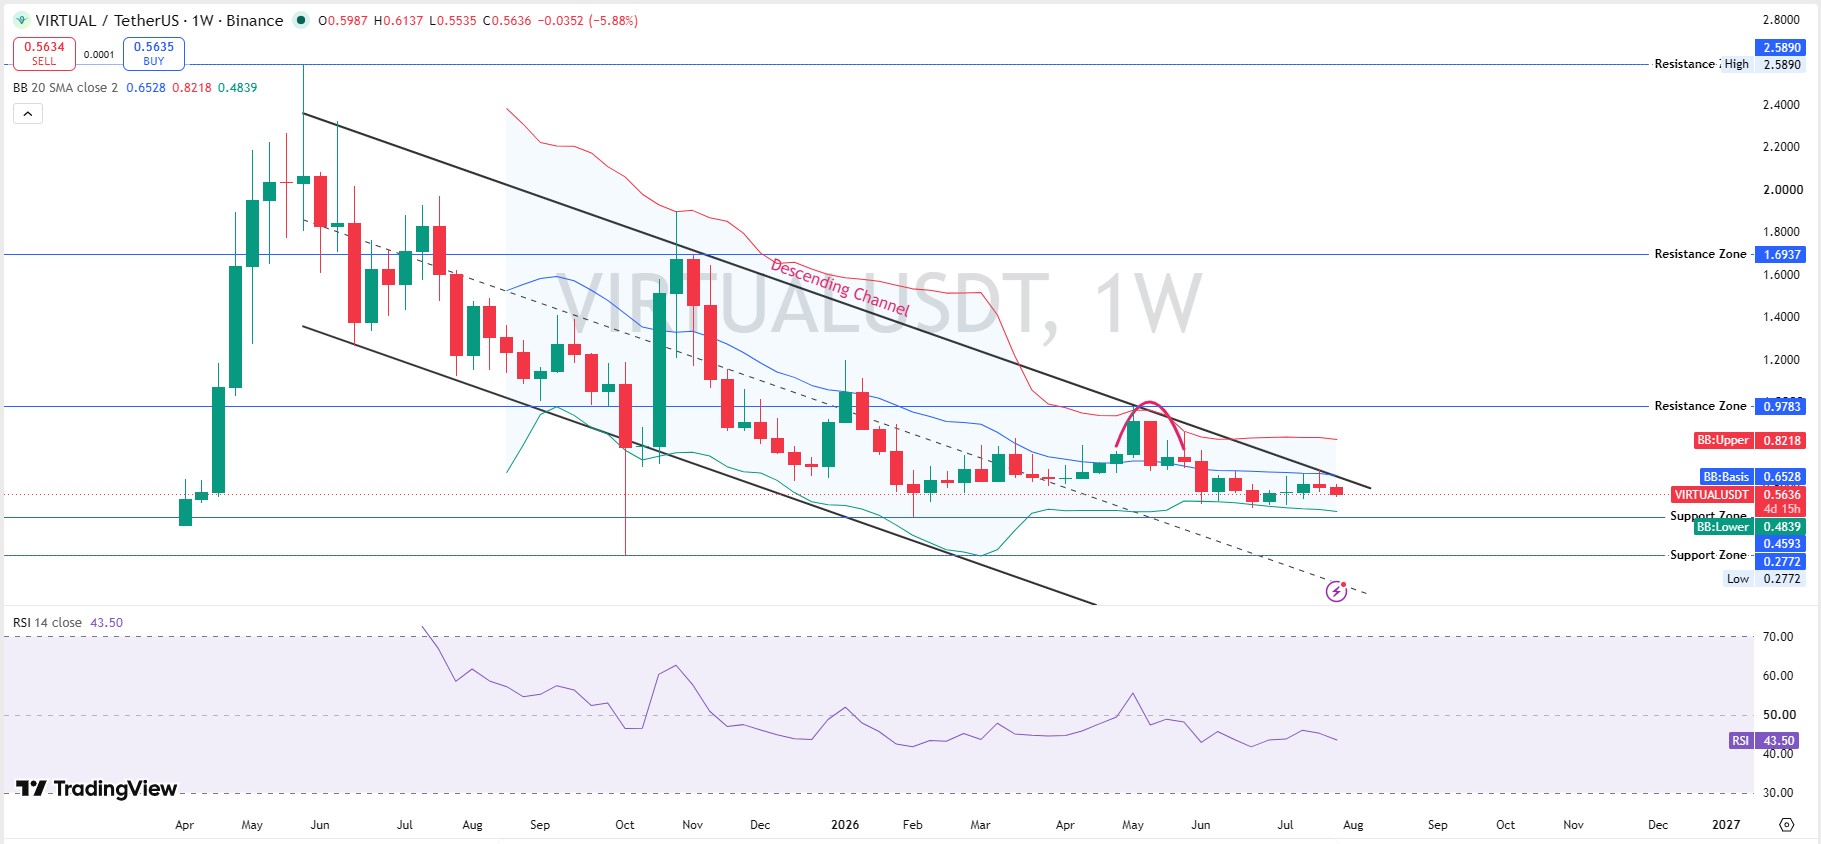
The larger picture shows the same descending channel stretching back to the all-time high near $2.59 in mid-2025. VIRTUAL has been making consistent lower highs and lower lows since, with the recent daily-chart bounce attempt appearing here as just a minor rounding bump against the $0.9783 resistance zone before rejecting again. The weekly RSI at 43.50 is mid-range, broadly rangebound between 40 and 60 for months, indicating a low-momentum consolidation phase rather than a fresh trending move in either direction.
-
Support: $0.4593, deeper zone at $0.2772
-
Resistance: $0.6815, then $0.9783
-
Base case: continued consolidation between $0.50 and $0.62
-
Bull case: break above $0.68 with volume reopens the $0.98 zone
-
Bear case: loss of $0.4593 support
-
Invalidation: daily close below $0.4593
VIRTUAL Overview and Tokenomics
Virtuals Protocol is a launchpad and framework for tokenized AI agents.
| Metric | Value | Source |
|---|---|---|
| Market Cap | $370.97M | CoinMarketCap |
| FDV | $564.2M | CoinMarketCap |
| MC/FDV | 0.66 | CoinMarketCap |
| Circulating Supply | 657,519,320 VIRTUAL | CoinMarketCap |
| Max Supply | 1,000,000,000 VIRTUAL | CoinMarketCap |
| Turnover | 10.31% | CoinMarketCap |
| 24H Volume | $38.25M | CoinMarketCap |
| Holders | 32,834 (smallest base in this basket) | SoSoValue |
| Top 100 Concentration | 96.74% | SoSoValue |
| Whale Concentration | 96.63% | SoSoValue |
| Gini Score | 0.9965 | SoSoValue |
| Top Holders | Base Bridge: 49.69% ($279.5M) PathDAO Treasury: 34.65% ($191.6M) | SoSoValue |
Those two wallets alone hold over 84% of the total supply. As with RENDER's bridge wallet, the Base Bridge figure reflects bridged-asset custody rather than a single private holder, verifiable on VIRTUAL's Etherscan contract page.
For the recent bounce context, see Virtuals Protocol price coverage.
Where Ozak AI Fits In
Ozak AI isn't a listed token yet, so it doesn't belong in the same technical-analysis bucket as the coins above. As of July 28, 2026, its presale was 99.37% sold with roughly $7.51M raised at a $0.014 presale price, and CertiK and Sherlock audits are complete with no critical findings. It also ran a joint event with Wikex Exchange on July 28 as part of an ongoing partnership series, a community/growth panel rather than a listing announcement.
No listing date, exchange, or trading pair has been confirmed. "Final countdown" and similar urgency language circulating around the presale aren't sourced to any official statement; it's community and marketing framing. Treat presale-stage tokens like this as higher risk than listed assets with real order books: there's no live market to validate price discovery yet, and outcomes depend heavily on whether and where a listing actually happens. See coin events calendar is a good place to check once a listing date is actually confirmed.
Key Takeaways
-
Seven of eight tracked AI tokens are down on both daily and weekly charts as of July 29, 2026.
-
Bittensor (TAO) is the lone token green on the day, coiling inside a descending triangle near $184-192 support.
-
Fetch.ai (FET) and NEAR both broke key trendlines this week, the weakest technical setups in the group.
-
Grass (GRASS) is the only chart still inside a daily uptrend, though it sits within a larger multi-month base.
-
Akash (AKT) is the most oversold token by RSI, with no confirmed reversal signal yet.
-
Ozak AI remains in the presale stage with no confirmed listing date; audits are clean, but listing risk is unresolved.
For airdrop opportunities tied to these ecosystems, check crypto airdrops tracker separately, since none of these levels should be read as a signal to farm one.
Glossary
-
RSI (Relative Strength Index): A 0-100 momentum gauge. Above 70 signals overbought; below 30 signals oversold.
-
EMA (Exponential Moving Average): A moving average weighted toward recent price action, used to gauge trend direction.
-
Descending/Ascending Channel: Parallel trendlines containing price action, sloping down or up, respectively.
-
Falling Wedge: A converging pattern often watched for a bullish breakout, though only once confirmed.
-
Bollinger Bands (BB): Volatility bands around a moving average; price touching the lower band can signal an oversold extension.
-
FDV (Fully Diluted Valuation): What market cap would be if all tokens, including locked/future supply, were circulating.
Methodology
-
Chart levels: Drawn from daily and weekly TradingView charts (Binance and Kraken feeds) using RSI-14, EMA, Bollinger Bands, and visible channel/wedge structure, captured July 29, 2026.
-
Market cap, FDV, supply, turnover, price: Sourced from CoinMarketCap, current as of the same date. TAO's circulating-supply figure varies slightly (roughly 9.6M-11.17M) depending on how staked TAO is counted at the time of the snapshot.
-
Holder and whale concentration data: Top 10/top 100 shares, Gini scores, and labeled wallets reflect on-chain holder-distribution data in the style reported by SoSoValue. NEAR and TAO don't have a comparable standardized breakdown available, so network-activity metrics are used for NEAR, and no holder breakdown is given for TAO.
-
Derivatives data: Coinglass pages were checked for funding-rate and open-interest context, but live numeric readings weren't confirmable at the time of writing, so specific funding-rate or open-interest figures aren't included here rather than the risk of stale or approximate numbers.
-
Ozak AI presale figures: Drawn from its official dashboard, captured July 28, 2026.
-
Freshness: This is a live snapshot; levels and holder data will shift as new information comes in.
Disclaimer: This article is speculative market commentary only and does not constitute financial, investment, trading, or legal advice of any kind. Nothing here is a recommendation to buy, sell, or hold any asset. Cryptocurrencies, including every token covered above and especially presale-stage tokens like Ozak AI, are highly volatile, largely unregulated, and can lose most or all of their value quickly and without warning. Past price action and technical patterns do not guarantee future results. Do your own research and consult a licensed financial advisor before making any investment decision. All prices, levels, and data points in this article are a snapshot as of July 29, 2026, and can change at any time; verify current figures independently before acting on anything here.









.jpg)








