UnifAI Network Price Prediction 2026: Can UAI Reclaim $0.60?


UAI is trading around $0.57 as of 02:10 UTC on September 2, 2026, up roughly 49% in 24 hours. That's a sharp move, and it's the reason this UnifAI Network price prediction matters right now. The weekly chart shows a clean ascending channel breakout, and momentum is leaning bullish. But short-term RSI is flashing overbought. Key resistance sits at $0.60, with support stacked at $0.3752 and $0.2056. The main catalyst: builder momentum around UnifAI's onchain-agent infrastructure. The main risk: this token is thinly held, and thin holdings mean sharp reversals.
Quick Prediction Box
Metric | Current Outlook |
Current Price | $0.57 (as of 02:10 UTC, Sep 2, 2026) |
Trend | Bullish, short-term overheated |
Immediate Target | $0.60 resistance zone |
Major Target | $0.8120 (1.618 extension) |
Support | $0.3752 |
Resistance | $0.6031 |
RSI | 83.15 (4h), 63.40 (weekly) |
Bull Case | $0.81–$1.15 |
Base Case | $0.42–$0.60 |
Bear Case | $0.28–$0.35 |
Invalidation | Weekly trade below $0.3752 |
UnifAI Network Price Prediction Today
UAI is priced near $0.5699, up about 49.34% on the day, according to real-time UAI market data. Over seven days the move has been even bigger, with the weekly candle up 40.54%. Market cap sits at $136.37M, and 24h volume is $24.81M, up over 208%. That's a huge liquidity spike for a token this size. $UAI trades roughly 7% below its all-time high of $0.612.
Why Is $UAI Price Moving Today?
Volume didn't just rise. It exploded.
$UAI Trading Volume and Market Momentum
Volume-to-market cap sits at 18.15%, well above what you'd call quiet. When we pulled up the UAI volume heatmap, Binance alone showed $220.93M in recent flow. That's dominant. Bybit and MEXC add meaningful secondary volume too.
Latest UnifAI Network Catalysts
UnifAI's team shared an official update on August 31 about giving AI agents the tools to execute onchain actions, not just respond. Developer-facing narratives like this tend to pull in speculative capital fast.
Turns out, timing lined up with the breakout. Traders following broader AI-linked crypto coverage have noticed the same pattern across other agent-focused tokens this cycle.
Bitcoin and Broader Crypto Market Impact
Bitcoin was trading at $77,583, down 1.66% on the day, with RSI at 66.08. Anyone tracking Bitcoin price trends will notice BTC isn't leading this move. UAI is running on its own steam right now, and that's worth watching closely.
UnifAI Network Technical Analysis
The setup here is stretched, not broken, as the live UAI trading chart makes clear.
UAI 4-Hour Chart Analysis
4-Hour (UAI/USDT, 4h)
This is the zoomed-in view of that same breakout. Price broke clean above its own ascending channel around August 31–September 1, rallying from about $0.30 to a high of $0.6021 in just a few days. 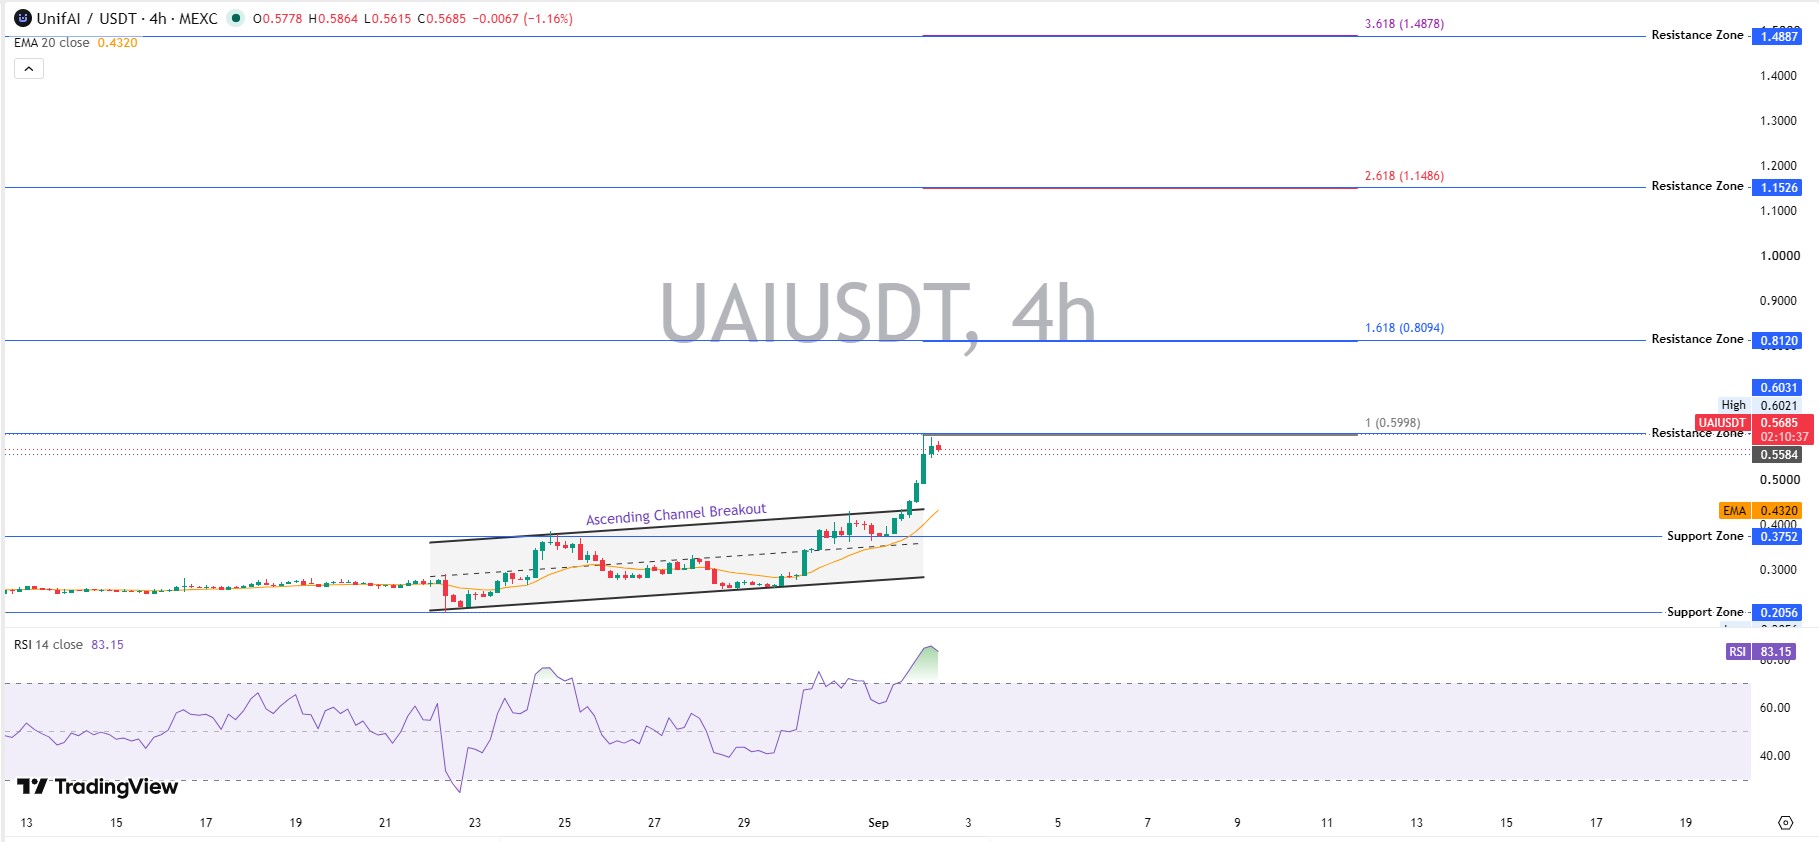
It's now consolidating right at $0.5685, sitting just under the $0.6031 resistance zone and basically glued to the 1.0 extension level at $0.5998. The candle is currently red (-1.16% on this candle), which reads as a short pause after the sprint.
RSI here is 83.15, which is deeply overbought, and you can see the RSI chart curling slightly down from its peak. The 20 EMA at $0.4320 is far below trades, another sign of overextension.
UAI Weekly Chart Analysis
Weekly (UAI/USDT, 1W)
Price is at $0.5432, up 40.54% this week (O $0.3870, H $0.6021, L $0.3617). The ascending channel that's been building since around February is intact, and this week's candle just pushed to the top of it. 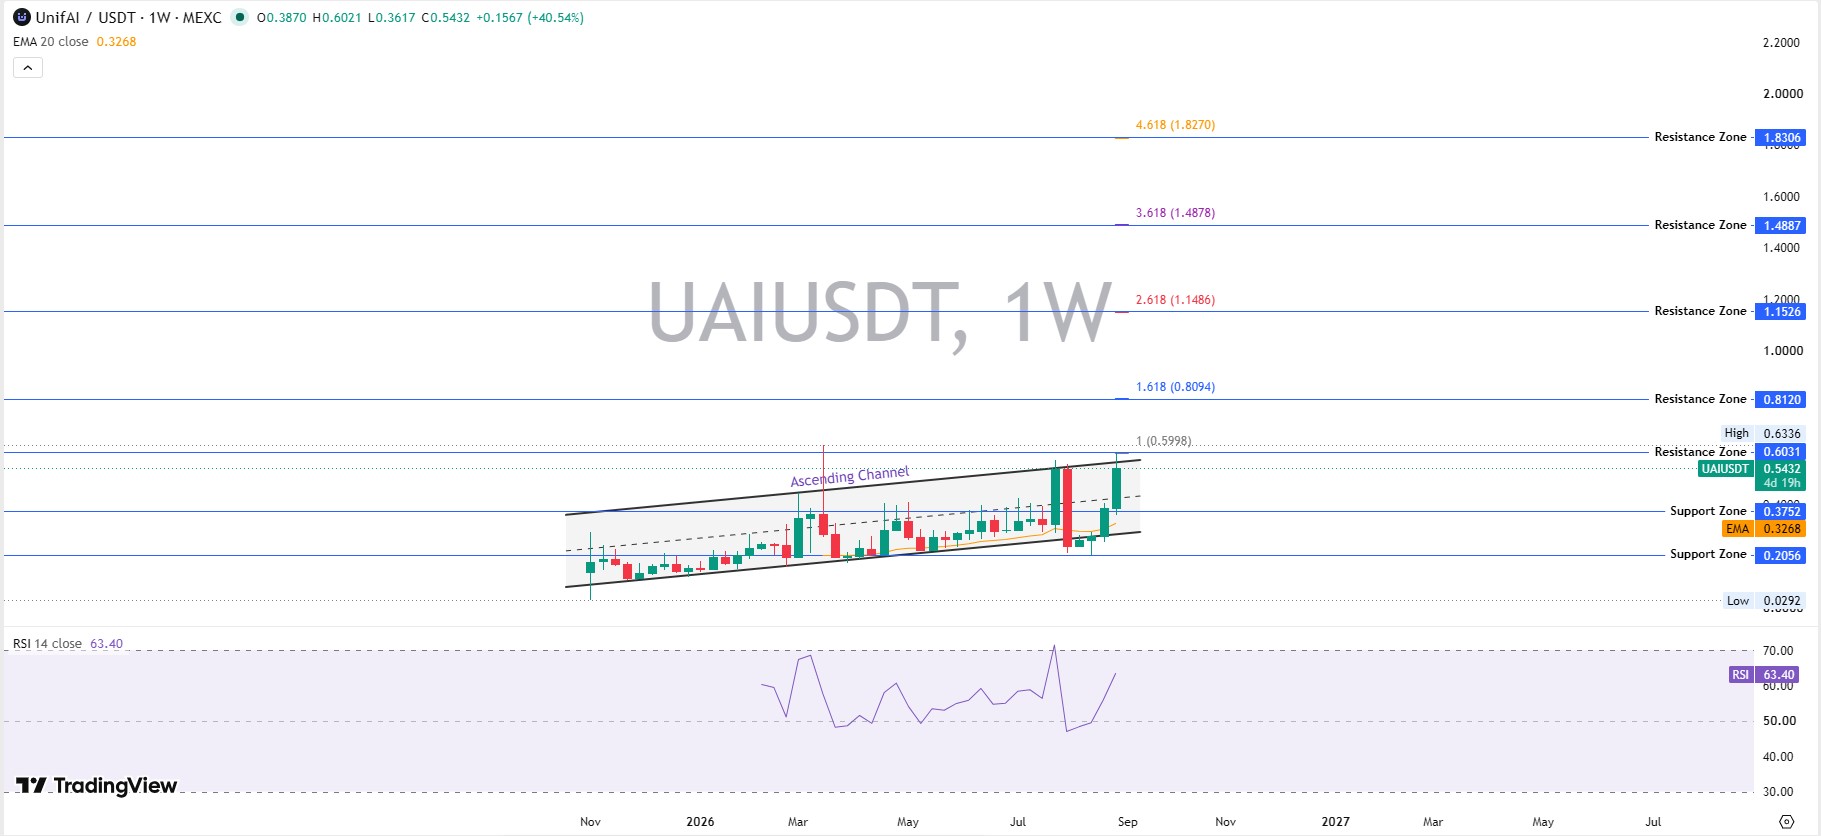
The 20-period EMA sits way below at $0.3268, showing how far price has stretched above its average.
RSI is at 63.40, which is firmly bullish but not overbought, so there's still room to run on this timeframe.
Resistance sits right overhead at $0.6031 (the 1.0 Fibonacci extension), then $0.8120 (1.618), then $1.1526 and beyond. Support underneath is $0.3752, with a deeper floor at $0.2056, a pattern also visible across other altcoin price forecasts tracking similar breakout setups.
UAI Support Levels
The nearest support zone is $0.3752. Below that sits a deeper structural floor at $0.2056. The 20-period EMA on the weekly chart is $0.3268, still trending up, and support tends to firm up further whenever recent exchange listing updates add fresh liquidity to a token.
UAI Resistance Levels
Immediate resistance is the $0.6031 zone, tied to the 1.0 Fibonacci extension. Above it, the 1.618 extension marks $0.8120. Then 2.618 sits near $1.1526.
RSI and Momentum
Weekly RSI reads 63.40. Healthy, not extreme. But the 4-hour RSI is at 83.15. That's deep, overbought territory. Here's the thing: overbought doesn't mean an immediate drop, but it does mean chasing here is risky.
Moving Averages
Trades are holding well above both the weekly and 4h EMA 20 lines ($0.3268 and $0.4320). That gap is wide. Wide gaps tend to snap back eventually, especially around dates flagged on an upcoming crypto event calendar.
MACD and Bollinger Bands
The 4-hour MACD reads 0.0574, sitting above its signal line at 0.0410, with a positive histogram of 0.0164 as of 01:36 UTC. That's a live bullish crossover. And the weekly MACD confirms it: 0.0459 above a 0.0372 signal line, histogram at 0.0087.
Bollinger Bands on the 4h chart show trades pressing the upper band at $0.5585, well above the $0.4147 baseline and the $0.2708 lower band. Turns out, that's classic band-riding behavior during a strong push. The weekly bands are wider: upper $0.4834, basis $0.3228, and lower $0.1622. Trades have punched clean through the weekly upper band already. That's not calm consolidation. That's a squeeze breaking loose.
Volume Confirmation
Volume rising alongside price is the strongest bullish signal here. And it's the one thing that keeps this from looking like a pure blow-off top, unlike the short-lived spikes tied to some active crypto airdrop campaigns.
UAI Price Prediction 2026
Scenario | Price Range | Condition |
Bear Case | $0.28–$0.35 | Weekly trades break below $0.3752 support |
Base Case | $0.42–$0.60 | Sideways trading between EMA and resistance |
Bull Case | $0.81–$1.15 | Trades break and hold above $0.6031 with volume |
Can UAI Reach $1?
Getting to $1 needs about a 75% climb from current levels. At $1, with 239M circulating $UAI, market cap would be near $239M. Fully diluted, at 1 billion max supply, that's a $1B valuation. UAI's all-time high is $0.612, so $1 would be new territory entirely. Volume right now, $24.81M daily, could support that move if it holds. It won't hold without fresh catalysts, though, and this deeper UAI whale concentration risks breakdown explains why.
UnifAI Network Price Prediction 2027
By 2027, adoption of on-chain AI agent infrastructure becomes the swing factor. If the AI narrative stays hot, tracked closely through AI sector crypto updates, and token unlocks stay controlled, $0.90 to $1.80 becomes reachable. If BTC turns bearish, expect $UAI to fall toward $0.20 to $0.30 instead. Network development matters more than hype at this stage.
UnifAI Network Price Prediction 2030
Avoid simple math here. Multiplying today's price by ten means nothing without market-cap context. Assuming a mature AI agent sector and full token dilution near 1B supply, alongside the kind of rotation seen in speculative token market trends:
Bear case lands near $0.10 to $0.15 ($100M–$150M cap).
The base case sits at $0.50 to $1.00.
The bull case, tied to sector leadership and a strong crypto cycle, reaches $1.80 to $2.50, near the 4.618 extension zone.
UAI Bull Case vs Bear Case
Bull Case
Break above $0.6031 on strong volume, hold it for two straight weekly closes, and the door opens toward $0.81 and beyond. Momentum like this often lines up with broader exchange listing activity across the sector.
Base Case
UAI chops between the EMA and resistance, digesting the recent 49% pump without giving it all back.
Bear Case
A fast breakdown below $0.3752 sends $UAI hunting for the EMA support near $0.20.
What Would Invalidate the Bullish Thesis?
A weekly trade closing below $0.3752 breaks the ascending channel structure entirely. That's the line.
Key Risks for UAI Investors
Whale concentration is extreme. Top 10 holders control 92.34% of supply, according to on-chain holder concentration data. The top 5 alone hold 79.21%. That's not diversified.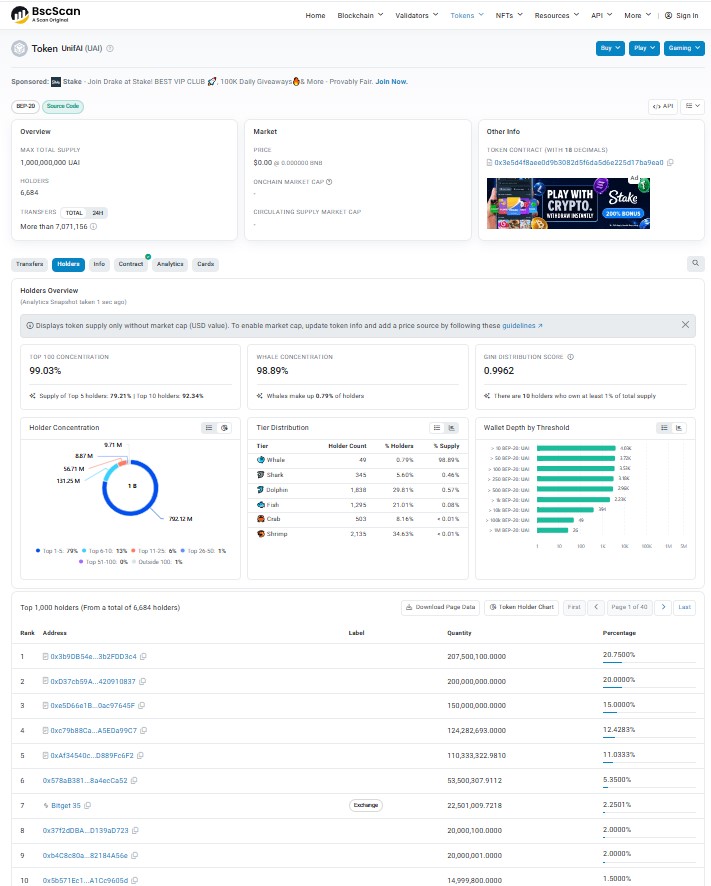
And token unlocks could add fresh sell pressure as more of the 1B max supply enters circulation. Liquidity is thin too, at 0.85% liquidity-to-market-cap. Leverage is already active: 24h liquidations hit $1.77M, with shorts taking the bigger hit at $1.14M. Add in AI-narrative rotation risk, Bitcoin weakness, and standard regulatory uncertainty, the kind investors usually flag on any tracking major catalyst events page. It's a stacked risk list.
UAI Price Targets and Invalidation Levels
Level | Meaning |
Support 1 | $0.3752, short-term defense |
Support 2 | $0.2056, major structure |
Resistance 1 | $0.6031, immediate breakout |
Resistance 2 | $0.8120, major target |
Bullish Confirmation | Break above $0.6031 with rising volume |
Invalidation | Weekly trade below $0.3752 |
Trader Takeaway
Above $0.60 with volume, this trend keeps running. Between $0.42 and $0.60, it's consolidation, nothing more. Below $0.3752, the bullish structure breaks down. Rising volume strengthens any breakout. Falling volume on a push higher? Treat that as a warning, not confirmation, the same way seasoned readers of wider crypto price outlooks treat any divergence signal.
Disclaimer: This article is for informational purposes only and isn't financial advice. Crypto markets, especially low-cap tokens like UAI, are highly volatile. Do your own research and consult a licensed financial advisor before making any investment decisions.
Also read:
















