UnifAI Network Price Prediction 2026: Can the 50% Rally Hold


A small AI-agent token just posted one of its sharpest weeks of the year, and traders who had it muted are suddenly paying attention again. Is this a real narrative shift, or just another AI-sector pump waiting to unwind?
Why UnifAI Network Is Suddenly Everywhere
This UnifAI Network price prediction matters because $UAI stopped being a background token this week. $UAI trades near $0.4616 as of July 30, 2026, up sharply on the day and roughly 50% on the current weekly candle.
CoinMarketCap's own snapshot showed an even bigger 24-hour move for UAI price today, near 50%, taken at a different capture time. Both readings point the same direction.
Here's the thing: two forces are stacked together here. The first is sector rotation, AI tokens including RSS3 and COTI rallied alongside $UAI this week, and that kind of group move usually means capital is rotating into a theme, not just one coin. The same pattern shows up across AI crypto price predictions this month, not just $UAI in isolation.
The second is volume. Trading volume jumped 479% to roughly $24.77M in 24 hours. That's real buying pressure, not just a thin-book spike.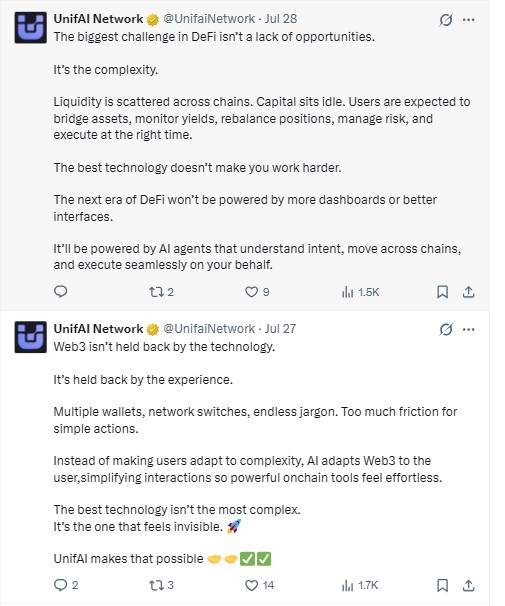
UnifAI's own posts lean into an AI agent's narrative for fixing DeFi complexity, most recently on July 28 on X. But it's a positioning post, not a confirmed listing or partnership. Worth remembering before calling this $UAI crypto prediction a fundamentals-driven move.
UAI Technical Analysis: Is $UAI Bullish or Bearish
UAI is trading inside an ascending channel that has held since May on both timeframes. You can track this setup live on the UAI/USDT TradingView chart.
Daily Chart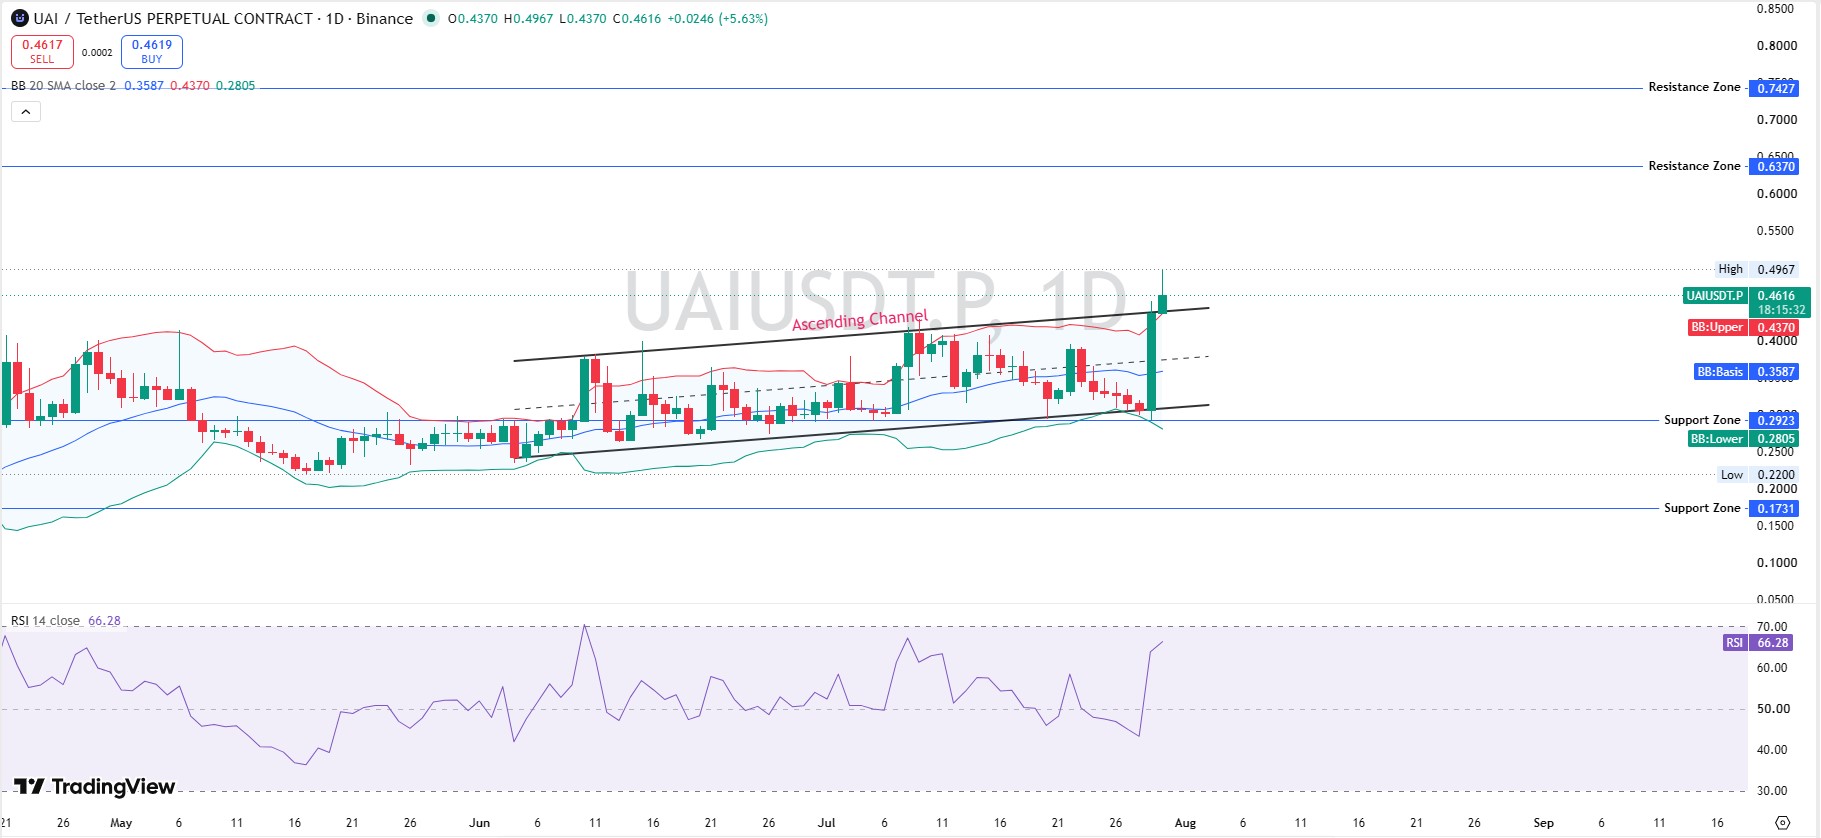
Price ran from $0.4370 to a high of $0.4967 before closing near $0.4616. That's a wide intraday range for a token that had been drifting quietly for weeks.
Daily RSI sits at 66.28. It's elevated, but it still has room before it hits classic overbought territory near 70-80.
Daily Bollinger Bands show a basis of $0.3587, an upper band at $0.4370, and a lower band at $0.2805. The price is trading above its own upper band right now. That's extension, and it usually means the move has run ahead of its own average, at least for a session or two.
Weekly Chart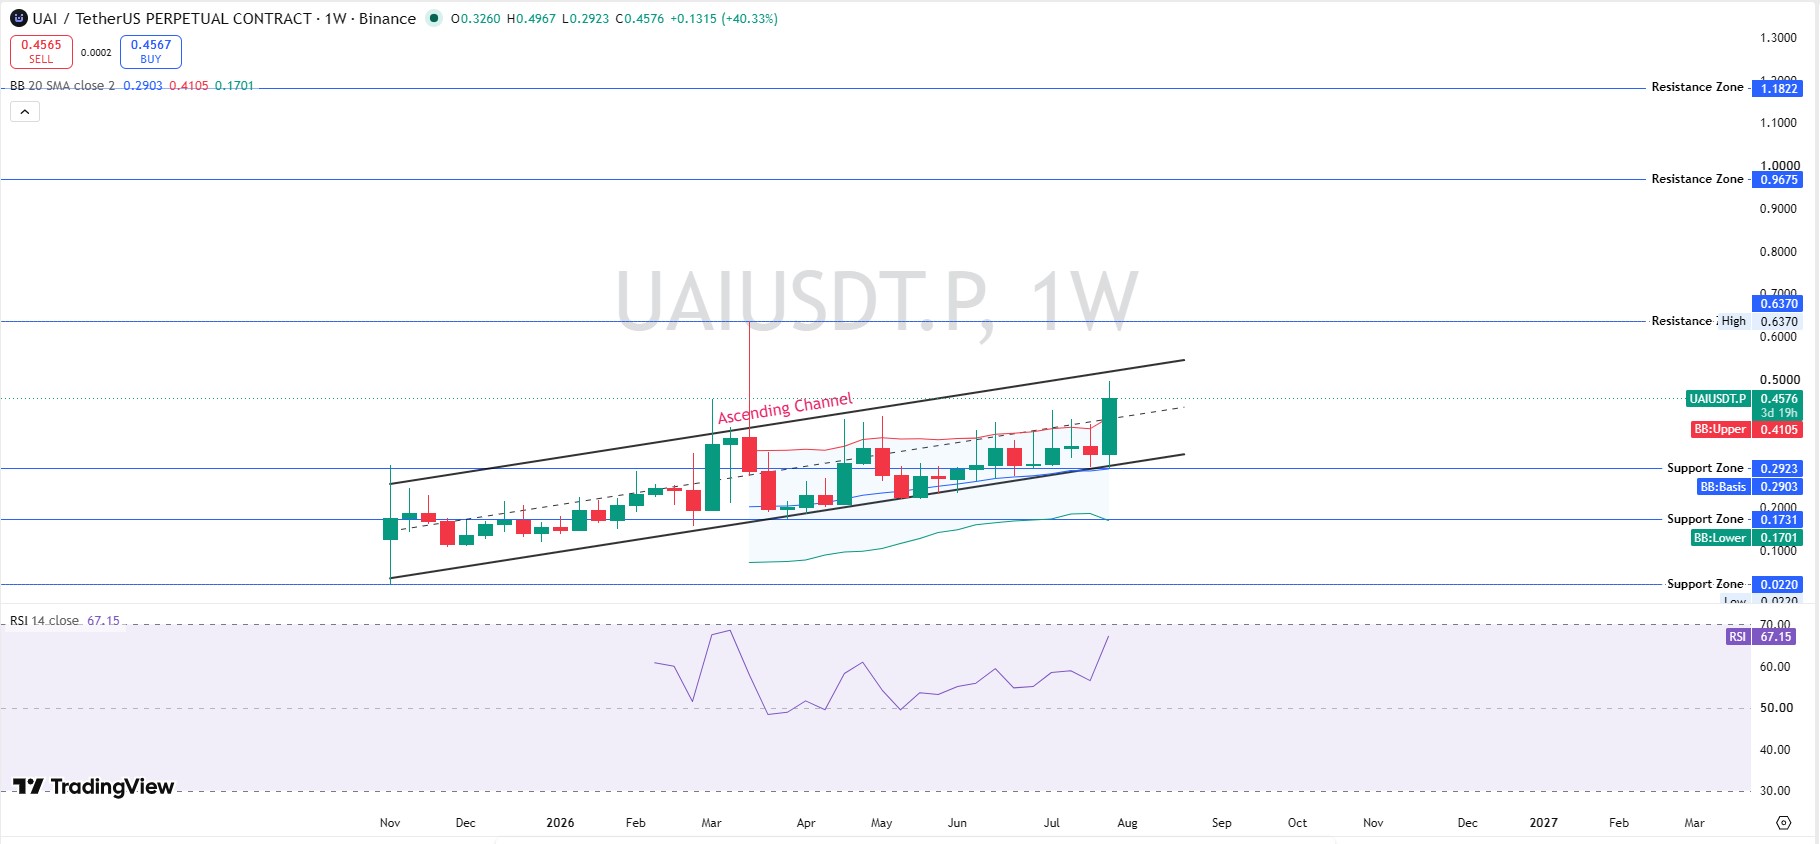
Weekly RSI reads 67.15. Neither reading is blown out like a classic overbought spike, and that gap matters less here than in most breakouts, since both timeframes agree.
That agreement is worth sitting with. When daily and weekly RSI move together instead of diverging, it usually signals the rally has broader support than a single-session squeeze.
Weekly Bollinger bands sit at a $0.2903 basis, a $0.4105 upper band, and a $0.1701 lower band. Same story: weekly price sits above the upper band too. It is a similar extension pattern to what showed up in the recent Bitcoin price prediction 2026 setup, where price also ran ahead of its own average before cooling off.
UAI Support and Resistance Levels
UAI resistance starts at $0.6370 and then a heavier zone near $0.7427, both visible on daily and weekly charts alike.
UAI support sits at $0.4370, the old daily upper band that often flips into a floor after a breakout. Below that: $0.2923, then $0.1731.
A daily close back under $0.4370 would put this breakout in doubt. A close under $0.2923 would confirm a deeper pullback, and that is the line most UnifAI Network price prediction 2026 calls should watch first.
Tokenomics and Whale Concentration
UnifAI Network runs on BEP-20. You can verify the contract directly on BscScan's UAI token page.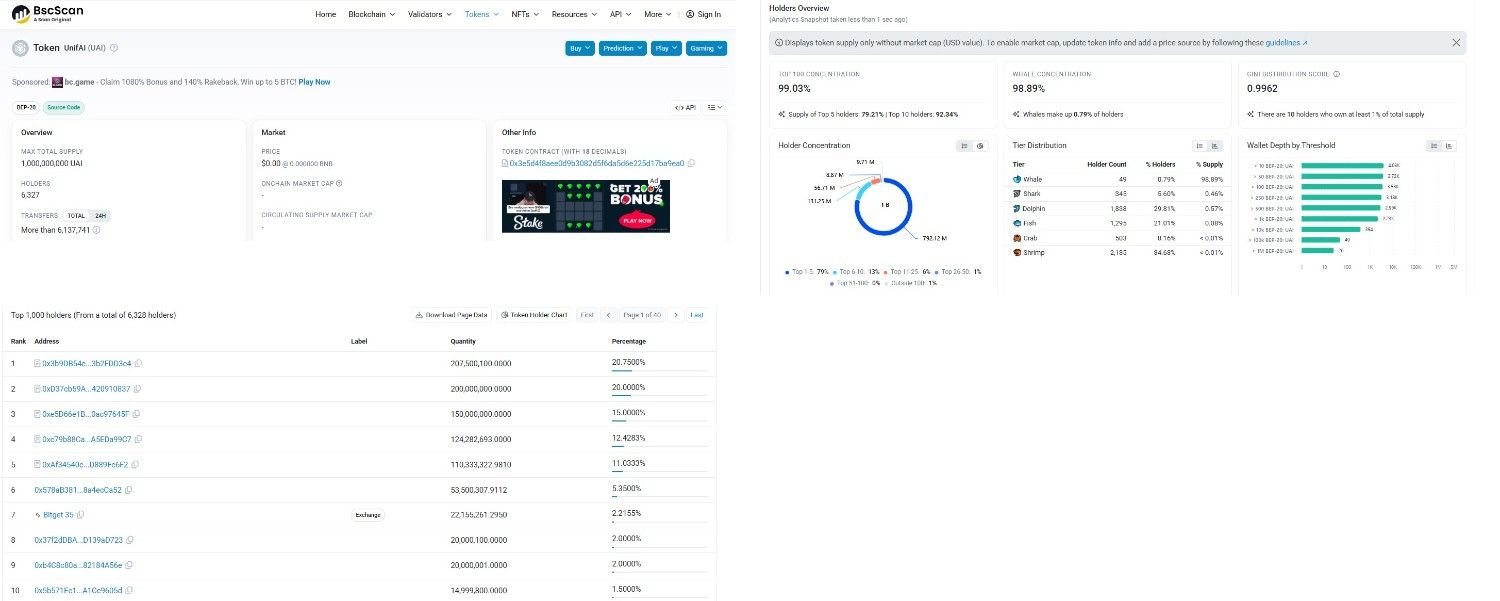
Max and total supply sit at 1 billion UAI, but circulating supply is just 239M, roughly 24% of the total. FDV is $452.3M against a market cap of $108.08M. That gap is an unlock risk worth flagging in any UAI price target 2026 discussion.
Now, the concentration numbers are severe. Top 100 wallets hold 99.03% of supply. Whale wallets, just 49 addresses, 0.79% of holders, control 98.89%. Gini score: 0.9962.
Top 5 wallets alone hold 79.21%. The single largest wallet holds 20.75%, unlabeled. It could be treasury or vesting; we cannot confirm which. Only one top-10 wallet, Bitget 35, carries an exchange label. That is about as tight as distribution gets, and it belongs in any honest UnifAI Network technical analysis.
Liquidity and Where $UAI Trades
Futures volume across venues tops $280M, led by Binance, Bybit, and Bitget. Full venue-by-venue splits sit on Coinglass's UAI liquidation page.
That dwarfs the $108.08M onchain market cap. Leverage is doing real work in this move.
Liquidations back that up. Over 24 hours, $1.84M got wiped out, $1.28M of it being shorts. But the most recent hour flipped; longs lost $47.56K against $24.70K in shorts. Early cooling, worth watching alongside the crypto exchange listing tracker for where fresh liquidity tends to show up first.
UnifAI Network Price Prediction: Scenarios by Timeframe
| Timeframe | Bull Case | Base Case | Bear Case |
|---|---|---|---|
| 24H | Reclaims $0.4967 and pushes toward $0.6370 (Probability: Moderate). | Cools to $0.40–$0.46 as RSI unwinds (Probability: High). | Fails at $0.4370 and slips toward $0.40 (Probability: Low). |
| 7D | A weekly close above $0.4616 opens a path to $0.6370 (Probability: Moderate). | Ranges between $0.35–$0.49 while the breakout retests (Probability: High). | Breaks $0.4370 and retests $0.29 (Probability: Low). |
| 30D | Sector rotation extends and UAI clears $0.7427 (Probability: Low–Moderate). | Consolidates between $0.35–$0.55 as the rally digests (Probability: Moderate). | Loses the $0.2923 support on fading volume (Probability: Low–Moderate). |
| 2026 | AI-sector rotation carries UAI toward $0.6370–$0.7427 (Probability: Low–Moderate). | Drifts between $0.30–$0.50, tracking broader sector sentiment (Probability: Moderate). | Unlock pressure or a fading narrative drags UAI toward $0.17–$0.20 (Probability: Low–Moderate). |
Invalidation for the bullish UAI price prediction this week is a daily close under $0.4370. These are directional reads, not guarantees.
Will UAI reach $1? Not on this move. That is more than double the current price and would need a market cap re-rating well past today's volume data. A more realistic $UAI price target sits near the $0.6370-$0.7427 zone flagged above, in line with how majors have led similar altcoin moves in the Ethereum price prediction 2026 setup.
UnifAI Network Price Prediction: What to Watch Next
The weekly candle is still open. A close above $0.4616 keeps the structure bullish; a close below it puts the whole breakout back in question.
Watch the 1-hour liquidation flip. Longs already took the bigger hit in the most recent hour, and if that pattern repeats over the next few sessions, it signals the squeeze is fading, not building.
Circulating supply is the quiet risk. Only 239M of 1 billion UAI trades today, and any scheduled unlock or vesting release could outweigh whatever the charts say. Upcoming unlock dates are worth checking against the coin events calendar before treating this breakout as settled.
Sector rotation can reverse fast. If AI tokens like RSS3 and COTI start cooling off, $UAI is unlikely to hold its gains alone, so this move is worth reading alongside the broader AI crypto price predictions picture rather than as a UAI-only story.
And keep an eye on UnifAI's own posts. So far they read as narrative building, not confirmed catalysts, so any actual listing or partnership announcement would change this UAI crypto price forecast quickly.
Risks to Watch
Whale concentration tops the list. A 0.9962 Gini score is a structural risk that does not disappear just because price is green.
Leverage sits right behind it. Futures volume running multiples above market cap means this move can unwind fast.
And the circulating-to-max-supply gap means future unlocks could pressure price regardless of near-term technicals. That risk traces back to how the token entered the market in the first place, covered in the UnifAI Network listing recap.
Whether UAI is a good investment right now depends on risk tolerance, since this setup mixes a real breakout with real concentration risk. Early holders got their allocation through the token launch itself, detailed in the airdrop and launch recap.
Methodology: Chart levels came from UAI/USDT daily and weekly charts on Binance via TradingView, RSI-14, and 20-period Bollinger Bands, captured July 30, 2026. Supply and market cap data came from CoinMarketCap. Holder concentration and Gini score came from BscScan analytics. Liquidation and futures volume came from Coinglass.
Disclaimer: This is speculative market commentary, not financial advice. Crypto assets are volatile. Data is current as of July 30, 2026; verify live figures before trading.









.jpg)








