VeChain Price Prediction: Why $VET Up Today? Volume Surge 245%


$VET is breaking out, and short sellers are paying for it.
VeChain just cleared a multi-week downtrend, and Coinglass data shows $130K in short liquidations wiped out in the last 24 hours alone as the move caught traders off guard.
Trading volume is up over 245% in a day, and the token is up more than 10% on the day.
This VeChain price prediction looks at whether VET can build on the squeeze. Here's what the chart and liquidation data show.
Market data was checked on September 9, 2026, at 02:18 UTC-3.
VeChain Price Prediction Today: Market Overview
Metric | Value |
Price | $0.0080087 |
24h Change | +10% |
Market Cap | $684.38M |
FDV | $690.17M |
24h Volume | $50.1M |
Vol/Mkt Cap (24h) | 7.32% |
Total Supply | 85.98B |
Max Supply | 86.71B |
Circulating Supply | 85.98B |
Source: Data from CoinMarketCap as of September 9, 2026, at 02:18 UTC-3. Figures may vary slightly across other tracking websites.
VeChain Liquidations and Futures Volume
VET's breakout triggered a clear short squeeze.
Over the past 24 hours, total liquidations hit $177.39K, split between $47.07K in longs and $130.32K in shorts—short sellers took the bigger hit as price pushed higher.
The 12h window shows a similar pattern ($46.22K total, $25.64K of it shorts), while the 1h and 4h windows stayed light, suggesting the squeeze has cooled off for now rather than accelerating.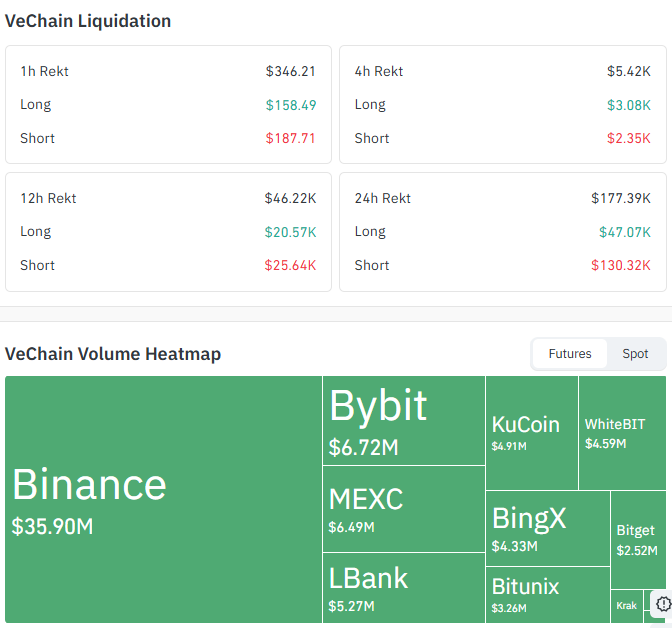
Source: Data From CoinGlass
On futures volume, Binance dominates VET trading with $35.90M, followed by Bybit ($6.72M), MEXC ($6.49M), LBank ($5.27M), KuCoin ($4.91M), WhiteBIT ($4.59M), BingX ($4.33M), Bitunix ($3.26M), and Bitget ($2.52M).
$VET Price Prediction: Technical Analysis
Pair: VET/USD · Market: Spot (Crypto) · Exchange: Composite · Timeframe: 4H · Source: TradingView · Timestamp: September 9, 2026, 02:18 UTC-3
$VET is trading at $0.0080087 after breaking above the descending trendline that had capped the price since late August.
The move was sharp and fast, and the price is now consolidating just under the $0.0081580 resistance zone right above it.
The chart's liquidity mapping shows resistance building up toward $0.0089609 and $0.0103637, while support levels stack below the current price down to $0.0069993.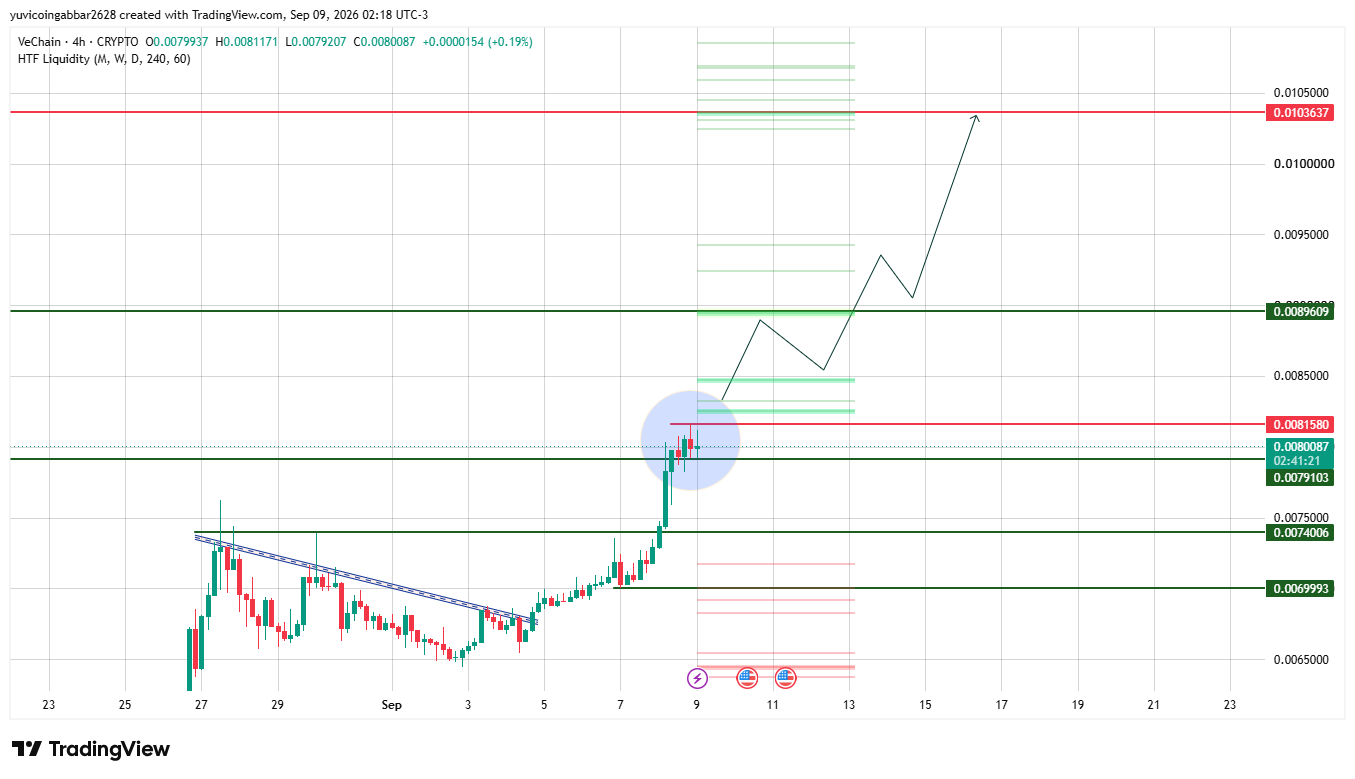
VeChain Future Price Short-Term: Key Levels
Level Type | Price |
Resistance 3 | $0.0103637 |
Resistance 2 | $0.0089609 |
Resistance 1 (nearest) | $0.0081580 |
Immediate Price Reference | $0.0080087 |
First Confirmed Support (trendline zone) | $0.0079103 |
Deeper Support | $0.0074006 |
Structural Floor | $0.0069993 |
VeChain Price Forecast: Bull Case vs Bear Case
Bull case: Holding above the trendline zone at $0.0079103 and clearing the nearest resistance at $0.0081580 would confirm the breakout is holding, not fading.
With shorts already being squeezed, a push through $0.0089609 could open the path toward $0.0103637.
Bear case: A close back below $0.0079103 would put the trendline reclaim in doubt and suggest the move was a short-lived squeeze.
Losing $0.0074006 would expose the structural floor near $0.0069993.
VET Price Prediction: Triggers and Invalidation Levels
Scenario | Trigger | Likely Outcome | Invalidation Point |
Bullish continuation | Hold above $0.0079103, break $0.0081580 | Move toward $0.0089609 and $0.0103637 | Close below $0.0079103 |
Range consolidation | Rejection at $0.0081580, hold above $0.0079103 | Sideways chop near current levels | Break below $0.0079103 |
Bearish breakdown | Lose $0.0079103 and $0.0074006 | Pullback toward the structural floor | N/A |
Can VET Reach $0.0103?
$0.0103637 is the highest resistance level marked on the chart.
Reaching it would require VET to first clear the nearest resistance at $0.0081580, then $0.0089609, and hold above both a multi-stage move that would likely need continued short covering and rising volume to sustain it.
VeChain Price Forecast and Outlook
The trendline break combined with a short squeeze is a constructive short-term signal, but the size of the move so far has been driven more by liquidation unwinding than by fresh spot demand.
If futures volume and CoinMarketCap 24h volume both stay elevated over the next few sessions, the VeChain price forecast favors a retest of $0.0089609.
Without that follow through, $VET risks drifting back into the $0.0079 & $0.0081 range it just broke out of.
VeChain Price Prediction 2026: Expert View
According to CoinGabbar analysts, This looks like a short squeeze layered on top of a genuine trendline break, which is a stronger setup than either alone. $0.0079103 is the level that separates a real breakout from a fade.
Disclaimer
This piece is for informational purposes only and isn't financial advice. The levels and scenarios above are based on technical chart analysis and publicly available data at the time of writing, and crypto markets can move sharply within hours, so past patterns don't guarantee future outcomes. It's worth doing independent research and considering your own risk tolerance before acting on any of the levels discussed here.
Also read:

















