What IF Price Prediction 2026: Can $IF Hold $0.02?


A brand-new token just swung from a 5-day high to a 1-day low and back again, and almost nobody outside a small trading circle noticed. That kind of move usually means one of two things: either early conviction is building fast, or the whole thing is a coin flip dressed up as a chart pattern. So which is it here? Before we get into candles and wallet data, it's worth asking what actually justifies this kind of volatility in a token that's barely a week old.
Why What IF Is Swinging So Hard Right Now
This What IF price prediction starts with a token that's almost impossible to read using normal rules. IF trades near $0.01543, up a sharp 140.81% over the past 24 hours, according to CoinMarketCap data.
That's not a typo. This coin hit an all-time high of $0.039 just five days ago, then crashed to an all-time low of $0.004809 a single day ago, per the same source.
Since that low, it's already up over 221%. Wild doesn't cover it.
There's no long price history to lean on here. So this What IF price prediction leans on what's actually verifiable right now: exchange listing calendar activity, on-chain wallet structure, and the two chart timeframes we do have clean data for.
Why IF Is Moving Today
New listings behave differently than established coins. Price discovery is still happening in real time, and that's exactly what's playing out with What IF.
The token runs on Robinhood Chain, an ERC-20 deployment, and it's still building out its holder base. Blockscout shows just 5,093 holders and 225,953 transfers total.
That's a thin, young network. Every large buy or sell moves the chart more than it would on an established token, which is exactly why this What IF price prediction treats today's move with caution rather than excitement.
Here's the thing: 24-hour trading volume sits at $1.74M, down 46.57% even as price rose, per CoinMarketCap. Volume cooling while price rips higher is a pattern worth watching, not ignoring.
Liquidity against market cap sits at 3.95%, and volume against market cap runs at 12.54%. Both numbers point to a market that's thin enough for a handful of wallets to swing the tape. Traders tracking similar early-stage listings can check our exchange listing tracker for context on how new tokens usually trade in week one.
Short-Term (4-Hour) Chart Analysis
On the 4-hour chart, IF trades around $0.01559, up 16.38% on the candle, sitting inside a descending channel that's held since the token's early August peak.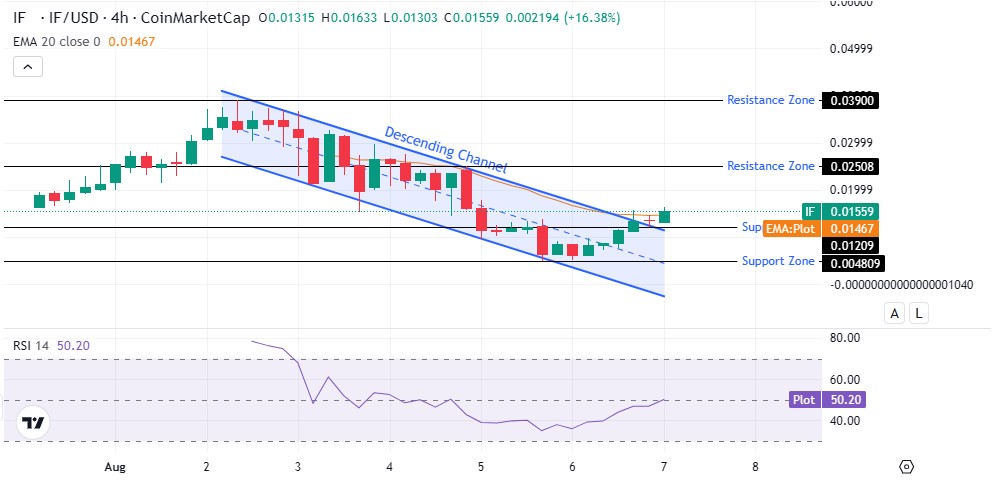
Price is trading above its 20-period EMA at $0.01467, a mildly encouraging sign for short-term momentum.
Resistance zones stack at $0.02508 and then $0.03900, the all-time high. Support sits at $0.01209; the all-time low is near $0.004809.
RSI-14 on this timeframe reads 50.20, dead neutral. Not overbought. Not oversold either.
That's actually notable given the size of the recent bounce. A push through $0.02508 would be the first real signal that buyers are back in control on this timeframe.
Weekly Chart Analysis
Zoom out to the weekly candle, and the story turns rougher. The week opened at $0.03352, touched a high of $0.03676, dropped to a low of $0.004809, and trades near $0.01534, down 54.29% for the week per CoinMarketCap data.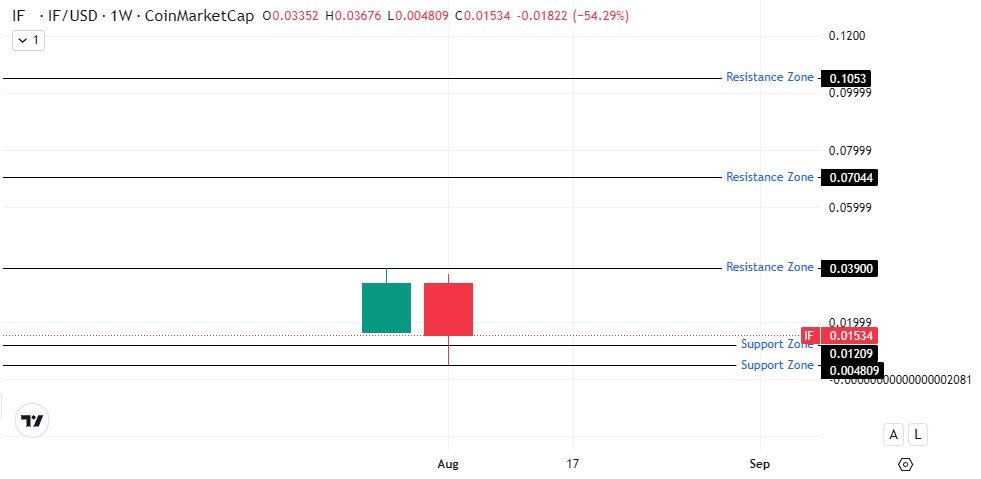
That's a brutal weekly range for a token this young. Weekly resistance zones sit far overhead at $0.03900, $0.07044, and $0.1053. Weekly support holds at $0.01209, then $0.004809.
Turns out, a 54% weekly loss followed by a sharp bounce is pattern for a token still finding its floor. It's not confirmation of a bottom. It's a warning that price discovery isn't finished yet.
What IF Support And Resistance Levels
Immediate support: $0.01209, then the all-time low at $0.004809. Immediate resistance: $0.02508, then the all-time high at $0.03900.
A 4-hour close above $0.02508 would ease near-term selling pressure. A weekly close under $0.01209 breaks the current support shelf entirely, and that's the real invalidation line for any bullish What IF price prediction is right now? Anyone comparing this setup to larger-cap coins can see how a mature chart behaves in the Bitcoin price prediction 2026 breakdown.
Tokenomics And Whale Concentration
IF has a fixed total and max supply of 1 billion tokens, with 913.47M IF currently circulating, according to CoinMarketCap. Fully diluted value sits at $15.43M against a $14.1M market cap, meaning most of the supply is already unlocked.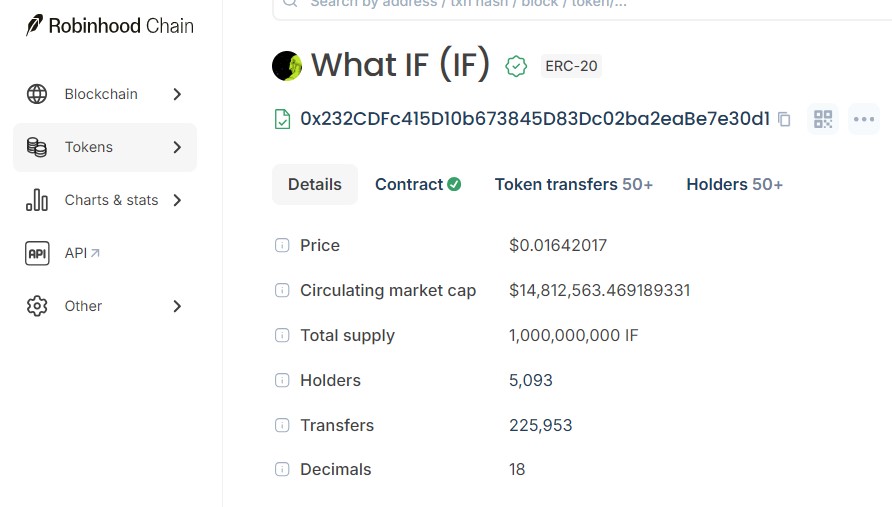
Wallet concentration tells its own story. Blockscout holder data shows the top wallet, a burn address holding 8.96% of supply, followed by individual wallets holding 3.23%, 3.12%, 1.56%, and 1.55%.
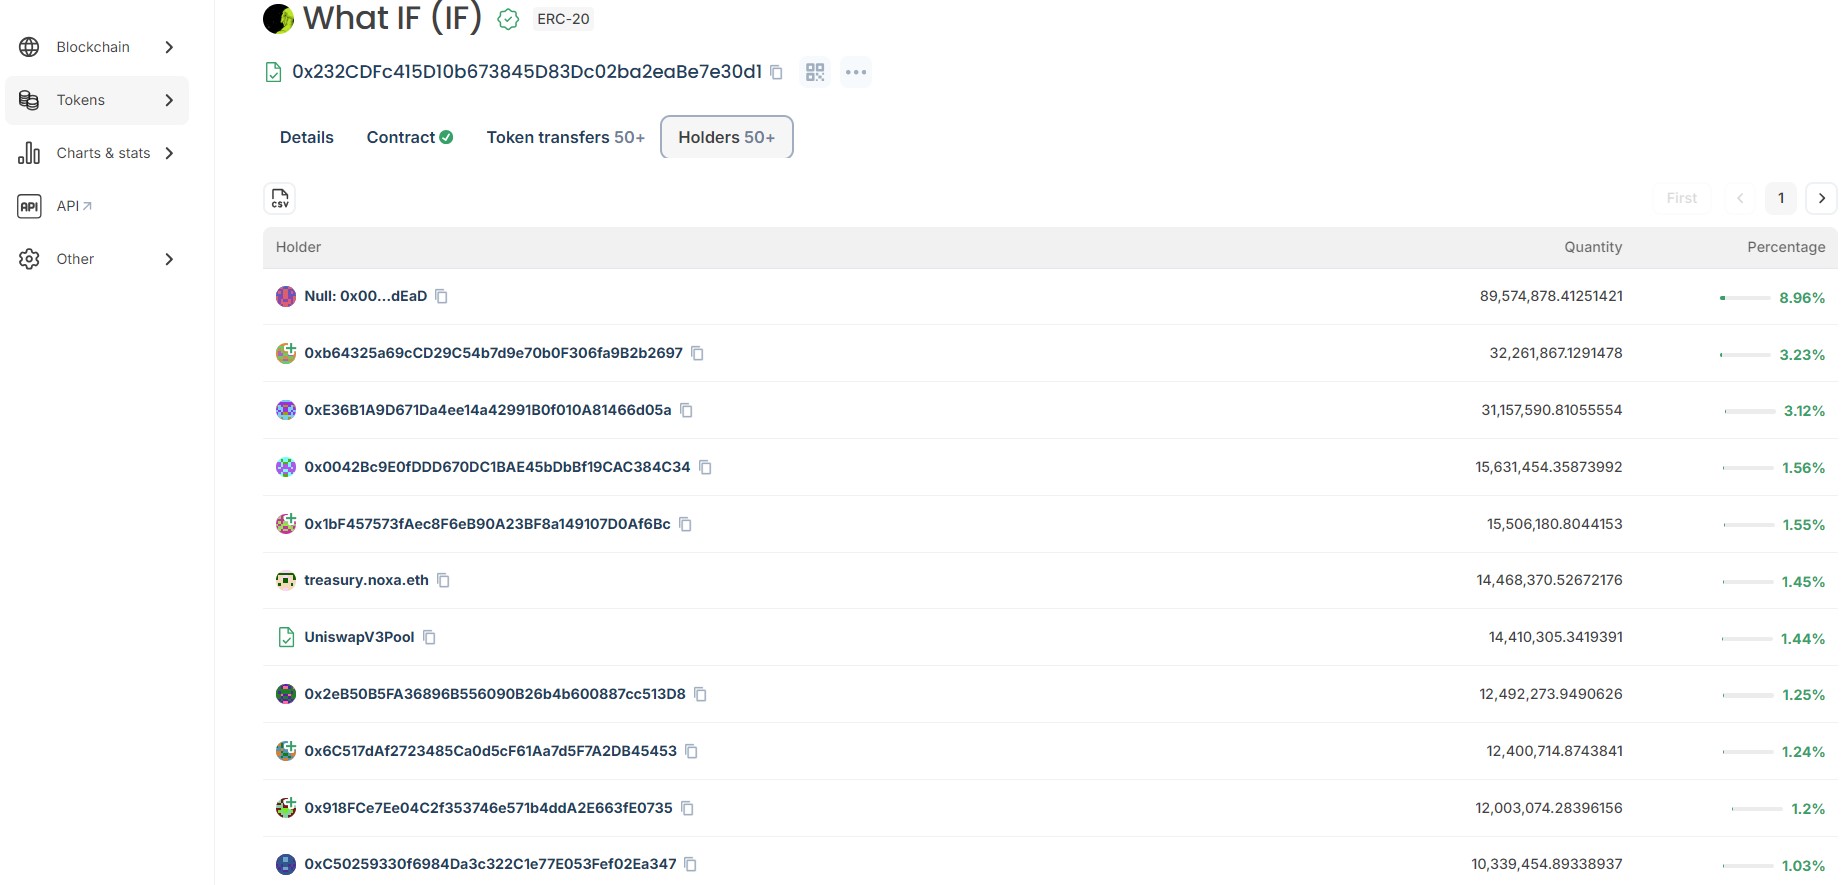
Further down the list, treasury.noxa.eth holds 1.45%, and the UniswapV3Pool wallet holds 1.44%, both structural rather than speculative holdings. The rest of the top ten sit between 1.03% and 1.25% each.
No single free-floating wallet controls a dangerous share on its own. But combined, the top ten non-burn wallets still hold a meaningful chunk of a token with only 5,093 total holders, and that's thin by any standard.
This wallet picture matters for any What IF price prediction because thin holder counts tend to amplify both rallies and drawdowns.
Is What IF A Memecoin Play?
Here's the thing worth saying plainly: the name, the branding, and the trading pattern all point toward memecoin-style speculation rather than a utility-driven token. When we pulled up the on-chain data, nothing in the contract or holder structure suggested a working product behind the ticker yet.
That doesn't automatically make it worthless. But it does change how a What IF price prediction should be read. Memecoin-style tokens can move 100% or more in a day on pure sentiment, and they can give it all back just as fast.
CertiK's rating on the contract sits at 3.6 out of 5 stars, a middling score that neither confirms nor rules out concern. Traders following similar meme-driven listings can track sentiment shifts through our memecoin news section.
Where What IF Is Actually Trading
IF is currently listed and tracked on CoinMarketCap with live price feeds pulling from its Robinhood Chain liquidity pool, based on the project's CoinMarketCap listing.
On-chain liquidity runs primarily through a Uniswap V3 pool, which held 1.44% of circulating supply at last check, per Blockscout token data. That's a thin liquidity base for a token already seeing triple-digit daily swings.
Anyone wanting to track fresh airdrop activity tied to similar new listings can check our crypto airdrops tracker for what's currently live.
What IF Price Prediction: Scenarios By Timeframe
Timeframe | Bull Case | Base Case | Bear Case |
24H | Reclaims $0.02508, tests $0.03900 (low) | Chops between $0.012-$0.018 (high) | Slips under $0.01209 toward $0.00875 (moderate) |
7D | A close above $0.02508 opens $0.03900 (low) | Range-bound inside recent channel (high) | A weekly close under $0.01209 retests $0.004809 (moderate) |
Aug 2026 | Breaks $0.03900, targets $0.07044 (low) | Drifts $0.010-$0.020 as volume normalizes (moderate) | Fails to hold support, revisits all-time low (moderate) |
Invalidation for the bullish case is a 4-hour close under $0.01209. A weekly close under the all-time low near $0.004809 would be the deeper warning sign.
What IF Market Outlook: Risks To Watch
Volatility tops the list here, and it's not close. A token that's moved over 200% in one direction and 60% in the other, both within a week, isn't a low-risk hold by any definition.
Liquidity depth is the second concern. With liquidity sitting at just 3.95% of market cap, large trades can move price far more than they would on a deeper-pooled asset.
And holder count still sits under 5,100. That's early. Really early.
This What IF price prediction leans cautious until volume stabilizes and the token builds a longer track record. New listings on our broader crypto news feed tend to follow a similar early-volatility curve before settling into a more predictable range, and IF hasn't reached that stage yet.
Glossary: Key Terms Explained
RSI (Relative Strength Index): A momentum gauge from 0-100. An above 70 usually means overbought, and a below 30 reading means oversold. IF's 4-hour reading of 50.20 sits right in neutral territory.
EMA (Exponential Moving Average): An average price that weights recent candles more heavily. Price trading above its EMA is a short-term positive tilt.
FDV (Fully Diluted Valuation): What the market cap would be if every token, including any not yet circulating, were counted at the current price.
Liquidity Ratio: Liquidity pool size divided by market cap. A low ratio means bigger price swings on smaller trades.
Methodology
Chart levels came from IF/USD 4-hour and weekly charts on CoinMarketCap, using RSI-14, EMA-20, and marked support/resistance zones, captured on August 7, 2026, around 09:00 UTC. Price, supply, and market-cap figures came from CoinMarketCap. Holder concentration and contract data came from Blockscout on Robinhood Chain. Project updates were cross-checked against the project's official account on X.
Disclaimer: This is speculative market commentary, not financial or investment advice. Crypto assets, especially new and thinly traded tokens, are highly volatile and can lose most or all of their value quickly. Data is current as of August 7, 2026; verify live figures before trading.