$ZEC Beats Bitcoin in the Rally: Zcash Price Prediction $2,000 Next?


Zcash is showing a moment: ZEC ripped past $975 in a single session, riding a market-wide rally that pushed total crypto value to its highest point in over seven months.
A spot Zcash ETF just went live on NYSE Arca, and traders are already asking if $1,000 is next.
This Zcash price prediction 2026 looks at whether the run has more room and what could slow it down.
Market data was checked on September 4, 2026, at 9:41 AM IST.
Zcash Price Prediction Today: Market Overview
| Metric | Value |
| Price | $949.958 |
| 24h Change | +15% |
| Market Cap | $15.97B |
| FDV | $19.9B |
| 24h Volume | $1.22B |
| Vol/Mkt Cap (24h) | 7.68% |
| Total Supply | 16.85M |
| Max Supply | 21M |
| Circulating Supply | 16.85M |
Source: Data from CoinMarketCap as of September 4, 2026, at 9:41 AM IST. Figures may vary slightly across other tracking websites.
Why Is Zcash Pumping? Crypto Market Cap Hits 7-Month High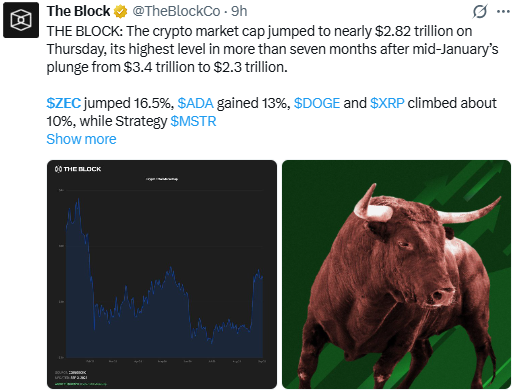
A post from The Block noted the total crypto market cap jumped to nearly $2.82 trillion on Thursday, the highest level in more than seven months since the mid-January plunge from $3.4 trillion to $2.3 trillion.
$ZEC led the move, up 16.5%, ahead of ADA's 13% gain and roughly 10% moves for DOGE and XRP.
CoinGabbar could not independently verify these figures beyond what was shared in the post.
Zcash ETF 2026: Grayscale Listing Fuels the Rally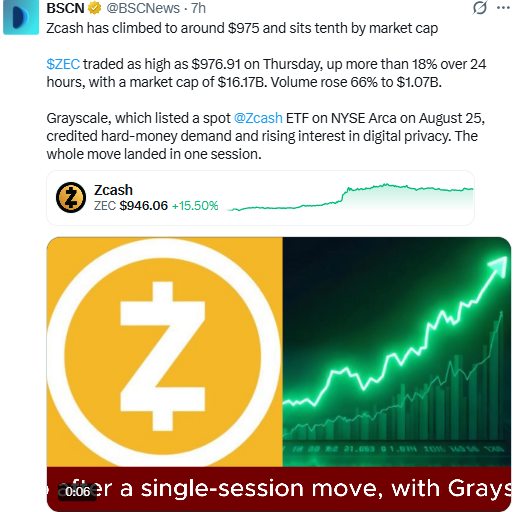
A post from BSCN reported $ZEC traded as high as $976.91 on Thursday, up more than 18% over 24 hours, with volume rising 66% to $1.07 billion.
The post credited Grayscale's spot $Zcash ETF listing on NYSE Arca on August 25 for the move, alongside rising hard-money demand and growing interest in digital privacy.
CoinGabbar could not independently verify these figures beyond what was shared in the post.
Zcash vs Bitcoin Investment Case 2026: Which Is the Better Buy?
Bitcoin price today sits at $81,001.10, up 4.21% over 24 hours. It's still the biggest and most trusted crypto asset, with the most liquidity and the most backing from big investors.
$Zcash is different from Bitcoin. It's much smaller, offers optional privacy, and just got a boost from a new spot ETF listing. Being smaller means ZEC can move faster than Bitcoin in both directions, with bigger gains but bigger losses too. Anyone checking the latest bitcoin price prediction will notice how differently these two move.
Compared to Monero , another privacy coin, it keeps privacy optional instead of forcing it, which made it easier for something like the new ETF to get approved.
There's no clear winner here, It really comes down to how much risk you're comfortable with, and this isn't investment advice.
ZEC Price Prediction Chart: Technical Analysis
Pair: ZEC/USDT · Exchange: KuCoin · Market: Spot (Crypto) · Timeframe: 1D · Source: TradingView · Timestamp: September 4, 2026, 09:41 UTC+5:30
ZEC trades at $949.958, up 15% on the daily candle, cooling slightly after a massive breakout candle launched price out of a multi-month consolidation zone between roughly below $700.
That base, below $703.288, and the consolidation between the $900.325 level, gave way to a sharp rally that carried ZEC to its current level.
Quick take: ZEC stays bullish above $900.325, with a close above $1,153.010 opening the path toward $1,566.903. A break below $900.325 would put this setup in question.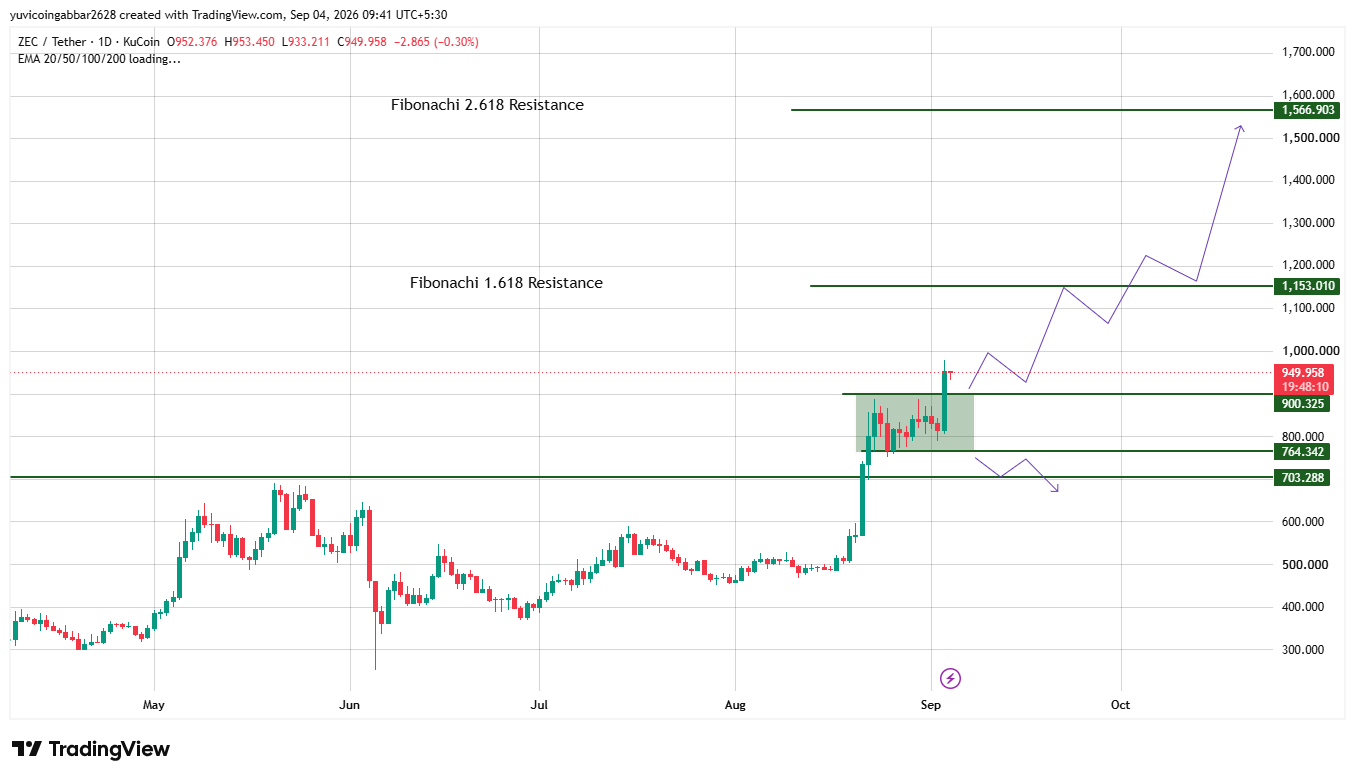
Price Forecast: Key Levels
| Level Type | Price |
| Resistance 2 (Fib 2.618) | $1,566.903 |
| Resistance 1 (Fib 1.618) | $1,153.010 |
| Immediate Price Reference | $949.958 |
| First Confirmed Support | $900.325 |
| Deeper Support | $764.342 |
| Structural Floor | $703.288 |
Zcash Price Forecast: Bull Case vs Bear Case
Bull case: Holding above the first confirmed support at $900.325 keeps the breakout intact. A confirmed close above $1,153.010 would open the path toward $1,566.903.
Bear case: A break below $900.325 would expose $764.342, and losing that would put the structural floor at $703.288 back in play.
Can $Zcash (ZEC) Reach $1,566.903?
$1,566.903 is the highest resistance level marked on the ZEC chart, at the 2.618 Fibonacci extension. Reaching it would require ZEC to first clear $1,153.010, a multi-stage move rather than a single leg.
Long-Term: $2,000?
Some traders are already eyeing the $2,000 mark as the next big level to watch. If the ETF inflows keep up, the long-term picture for ZEC could stay strong well beyond this rally.
Zcash Price Prediction: Expert View
According to CoinGabbar analysts , ZEC's breakout came alongside a market-wide rally and fresh ETF-driven demand, a stronger backdrop than a purely technical move.
$900.325 is the level that keeps the structure intact, with $1,153.010 the next test. A pullback into the old consolidation zone wouldn't be unusual after such a sharp run.
Disclaimer
This article is for informational purposes only and does not count as financial advice. The levels and scenarios discussed above come from technical chart analysis and publicly available data at the time of writing, and crypto prices can shift quickly within a single session, so historical patterns do not guarantee what happens next. Readers should do their own research and weigh their own risk tolerance before making any decisions based on the levels covered here.
















