Pump.fun Price Prediction: Can PUMP Reclaim $0.006036 in Nov?

Can PUMP reclaim $0.006036 after a week of steady burns and heavy long liquidations?
The Pump.fun price prediction for November 2026 starts with a token trading 1.6% above its first support zone. Price sat at $0.003925 on Nov 3, 2026, 04:00 UTC, and the launchpad behind it is covered in Pump.fun launchpad explained.
Pump.fun 24-Hour Market Snapshot
CoinGecko market data, captured Nov 3, 2026, 04:00 UTC, puts the PUMP price today at $0.003925 and ranks the token 52th.
Metric | Value |
PUMP price | $0.003925 |
24-hour price change | -7.13 |
Market cap | $1.801B |
Fully diluted valuation (FDV) | $3.23B |
24h trading volume | $93.484M |
Perps 24h open interest | $295.923M |
Total value locked | $311.712M |
Circulating supply | 459.72B PUMP |
Total supply | 824.607B PUMP |
Source: CoinGecko, captured Nov 3, 2026, 04:00 UTC.
FDV, or fully diluted valuation, is the value of every token in total supply at today's price. It stands at $3.23B.
Pump.fun Buyback News: $5,020,100 Burned in Seven Days
A buyback and burn means a project buys its own token on the open market, then sends it to a wallet nobody can spend from. That removes those tokens from supply for good.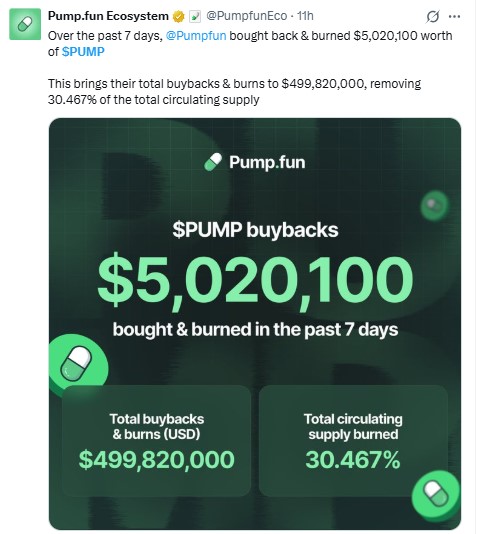
Source: official @PumpfunEco X post, as captured Nov 3, 2026, 04:00 UTC.
Per the official @PumpfunEco X post, Pump.fun bought back and burned $5,020,100 worth of PUMP over the past seven days. Total buybacks and burns reach $499,820,000, or about $499.82M, per the same post.
That total removed 30.467% of circulating supply, per the post.
If weekly burns hold, supply keeps shrinking. If buybacks slow, the PUMP buyback news loses its support, and the chart decides its next level.
Pump.fun Price Performance and the 24h Range
PUMP traded between $0.003878 and $0.004214 over 24h, a $0.000336 spread, per CoinGecko performance data captured Nov 3, 2026, 04:00 UTC.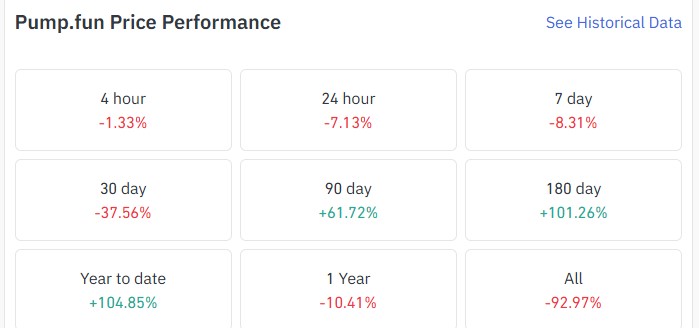
Source: CoinGecko, captured Nov 3, 2026, 04:00 UTC.
The 24-hour change reads -7.13%, and the 4-hour change is -1.33%.
The 30-day drop is -37.56%. Did that flush the weak hands already?
Not fully, since longs are still paying below. But the 90-day gain of +61.72% shows the pullback sits inside a larger climb.
PUMP Liquidation Data: Longs Take the Hit
Longs took the strike. PUMP liquidation data from Coinglass, captured Nov 3, 2026, 04:00 UTC, shows $1.15M liquidated over 24h.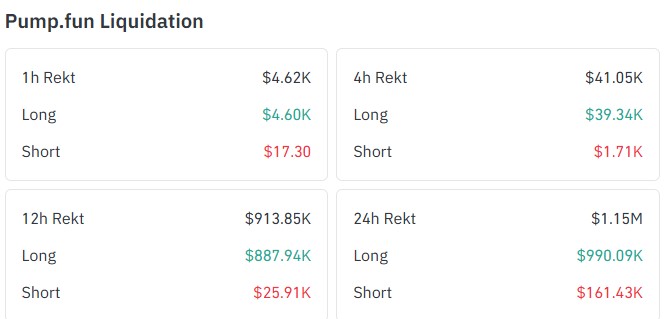
Source: Coinglass, captured Nov 3, 2026, 04:00 UTC.
Longs lost $990.09K of that. Shorts lost $161.43K.
Over the last 12h, the toll hit $913.85K. Longs took $887.94K, shorts just $25.91K. About 79% of the 24h total landed in that window.
Pump.fun Open Interest and Futures Volume Data
PUMP open interest is the total value of futures contracts still open and unsettled. CoinGecko lists perps 24h open interest at $295.923M, captured Nov 3, 2026, 04:00 UTC, while Coinglass futures volume ranks the venues.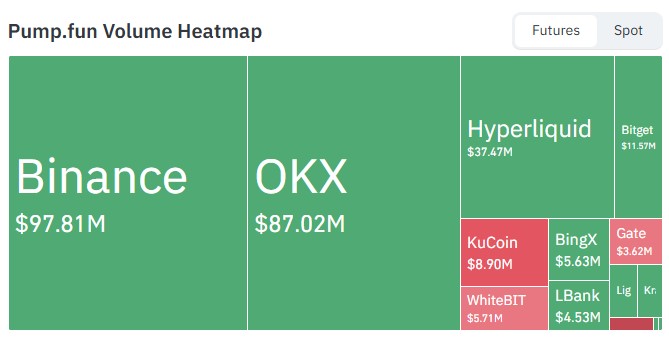
Source: Coinglass, captured Nov 3, 2026, 04:00 UTC.
Binance leads at $97.81M, with OKX second at $87.02M. The gap between them is $10.79M.
Hyperliquid ranks third at $37.47M.
Period Catalysts and Risks for the PUMP Price Forecast
The next weekly burn post from @PumpfunEco is the first item to watch, checked against the official PUMP token page.
Crowded positioning is the other risk to the Pump.fun price prediction. More crypto market news sits on the Coingabbar feed.
PUMP Technical Analysis: RSI and 50-Day EMA
The chart is a TradingView daily view of PUMP/USDT on OKX with a 50-day EMA and RSI 14, captured Nov 3, 2026, 04:00 UTC.
The Pump.fun price prediction starts with a long range trading between the $0.005179 and 50 EMA level, and also the price where the price chopped sideways near the $0.003432 and $0.003856 support level zones.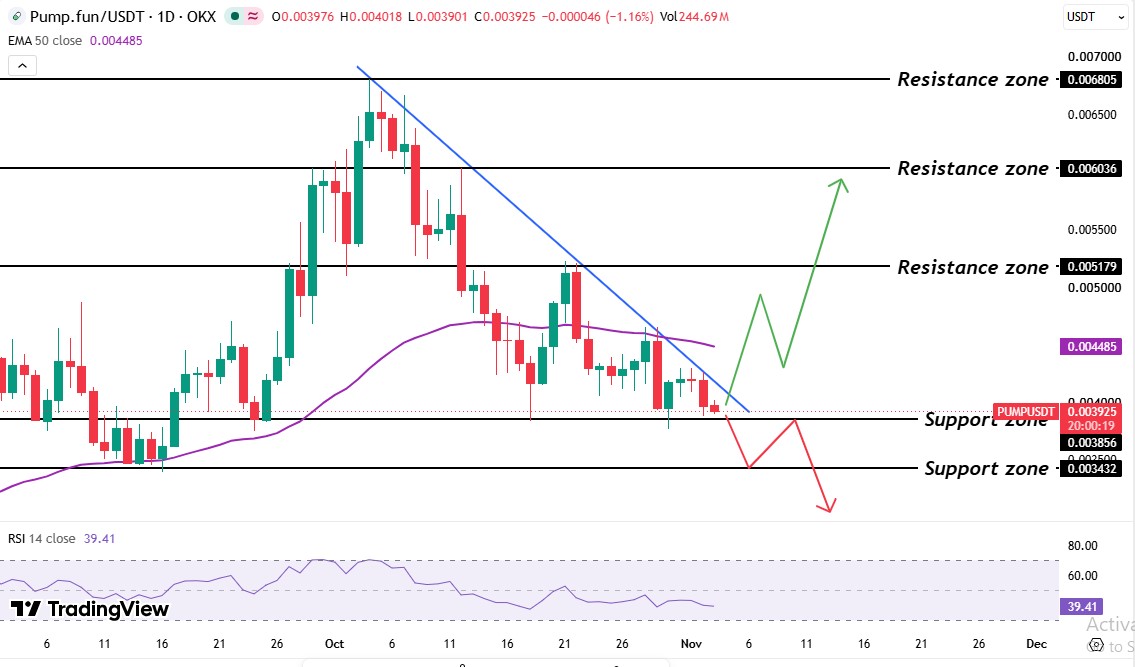
Source: TradingView, OKX PUMP/USDT, 1D, captured Nov 3, 2026, 04:00 UTC.
A rally followed in late September, and the price tested the $0.006805 level in early October, and after that, the price started going downward. That peak began a descending trendline, a line joining lower highs.
Lower highs and lower lows followed. A push to $0.005179 hit the trendline and reversed, and another breakout attempt failed days later. The latest daily candles now press the $0.003856 level.
The PUMP 50-day EMA sits at the $0.004485 level, and the price is trading below the 50 EMA, 14.5% above the price. Rallies toward that line meet selling.
PUMP RSI reads 39.41 on the 14-day setting. A bounce might seem due. since oversold starts below 30.
For the wider monthly view, the November price forecast adds more context.
Pump.fun Support and Resistance Levels
Level | Price |
Support | $0.003432 |
Support | $0.003856 |
50-day EMA | $0.004485 |
Resistance | $0.005179 |
Resistance | $0.006036 |
PUMP support levels mark zones where buyers stepped in before, while PUMP resistance levels mark zones where sellers capped rallies. The nearest pair is $0.003856 below and $0.004485 above.
Pump.fun Price Forecast: Bull, Base, and Bear Scenarios
Scenario | Trigger | Target | Invalidation |
Bull | Daily candle trades above $0.004485 | $0.005179 | Trades below $0.003856 |
Base | Price holds $0.003856 to $0.004485 | Retest of $0.003856 | Trades outside the band |
Bear | Daily candle trades below $0.003856 | $0.003432 | Trades back above $0.003856 |
Bulls need to break the trendline and the 50 EMA together to gain control. Bears only need to break the $0.003856 support level.
The main risks are a slower buyback pace, more long liquidations, and a daily candle trading below $0.003856.
Pump.fun Price Prediction: Expert Outlook
As per the Coingabbar analysis, Price holds a bearish bias on the Pump.fun price prediction, while the daily candle trades under the descending trendline and the 50-day EMA. The evidence is RSI at 39.41, $990.09K in 24h long liquidations, and a 30d drop of -37.56%.
The $5,020,100 weekly burn is small next to $295.923M in open interest. A retest of $0.003856 is the expected next move.
A daily candle trading above $0.004485 would clear the trendline zone and end the lower-high sequence.
Disclaimer: This article is for informational purposes only and is not financial, investment, or trading advice. Crypto prices are highly volatile, so readers should assess their own risk before making any decision.