Quant Price Prediction: Will QNT Reach $300 by October 2026 or Fade?


Quant price prediction searches exploded after $QNT gained 299.06% in 7 days. Traders comparing setups start at the price prediction hub.
This QNT trader guide covers levels, indicators, and risks.
$QNT Price Prediction Today
Breaking: The Quant Network price nearly quadrupled in a week.
As of about 04:00 UTC on September 28, 2026, QNT trades at $253.64, up 45.47%. CoinMarketCap live data shows a $3.06 billion market cap.
Volume hit $1.21 billion. Rank: #33.
$QNT Derivatives Snapshot
Basically, futures drive price discovery here. Coinglass shows $8.32 billion in futures volume against $606 million on spot.
Open interest, the total value of open contracts, sits at $153.50 million. Traders hunting new venues check the exchange listing tracker.
QNT Liquidations and Positioning
Turns out, shorts got hurt most. Liquidations hit $25.66 million in 24 hours, and $17.25 million came from shorts.
But Binance accounts still lean short, with a 0.7658 long/short ratio (below 1 means more shorts). And top trader positions lean long at 1.2421.
QNT Holder Data
Etherscan lists 172,471 holders. Turns out, ownership is lopsided.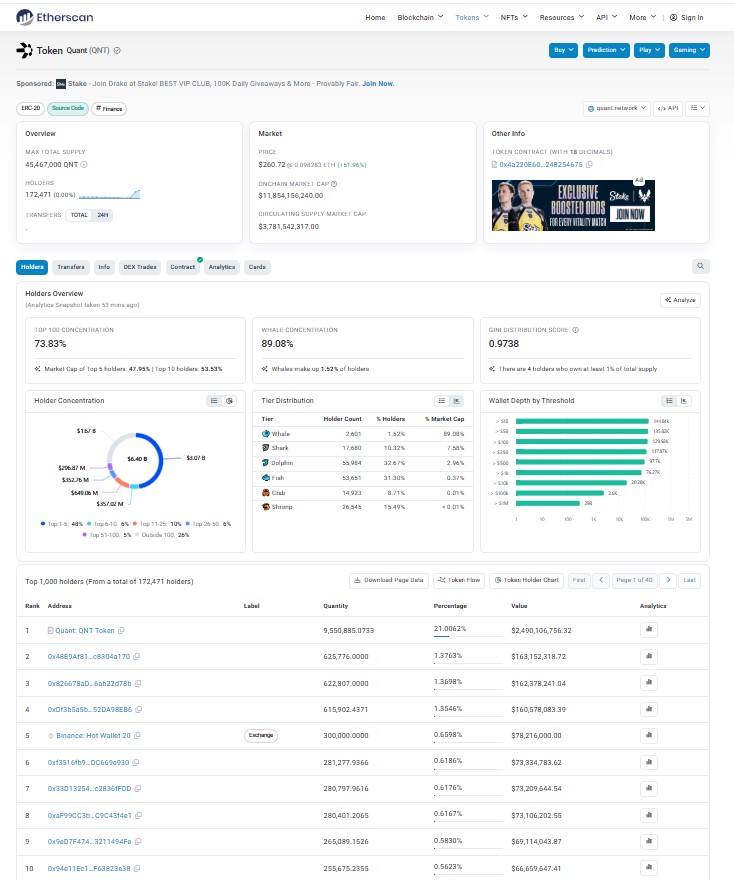
Whale wallets, 2,601 of them, control 89.08% of market cap. The Etherscan holder data also shows a Gini score (an inequality gauge, where 1 means one owner holds everything) of 0.9738.
Quant Technical Analysis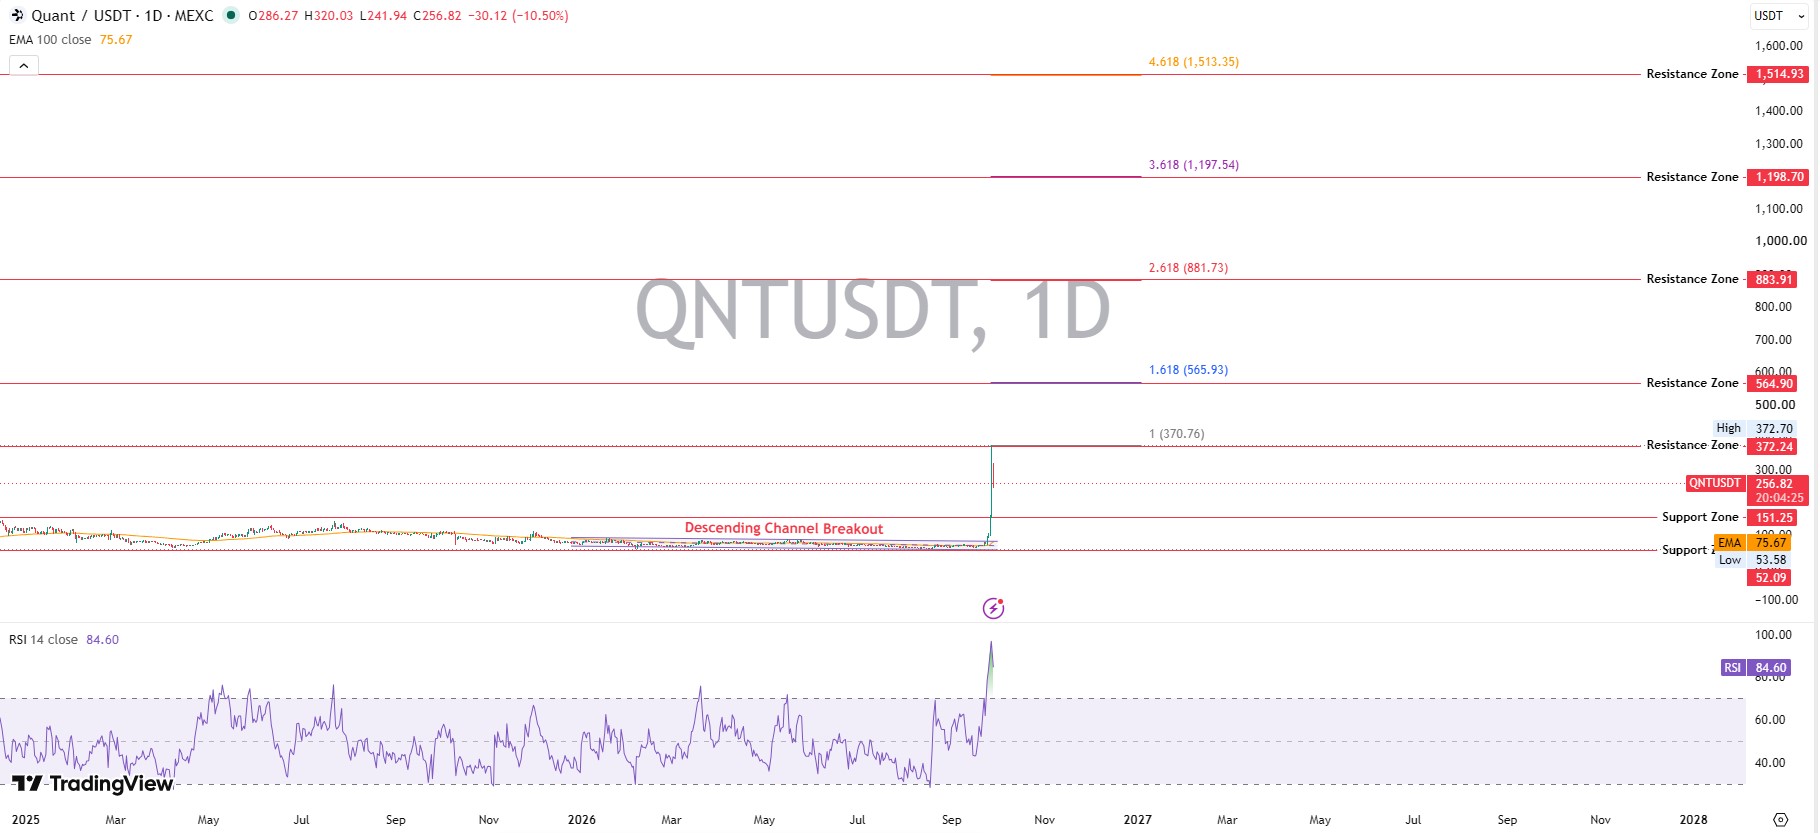
When we pulled up the daily chart, a descending channel breakout dominated the screen. A descending channel is a falling price lane, and escaping it flips bias.
Price trades far above the 100-day EMA (exponential moving average) at $75.67. Earlier levels sit in the previous QNT analysis.
$QNT RSI Analysis
RSI (Relative Strength Index, a 0 to 100 momentum gauge) reads 84.60. Above 70 means overbought.
Momentum, for now. Not conviction.
But RSI can stay hot during parabolic runs. And cooling usually arrives violently.
$QNT MACD Analysis
MACD (a trend-momentum tool) reads 35.48 against a 13.76 signal line. Histogram: 21.71.
Yet the latest daily candle trades 10.36% lower from a 320.03 high. Is this the top, or just a pause?
$QNT Support Levels
$QNT support levels sit at $151.25 and $52.09. The first marks the breakout base.
Losing $151.25 would erase about 40% from here. Ouch.
$QNT Resistance Levels
QNT resistance levels stack at $372.24, $564.90, $883.91, $1,198.70 and $1,514.93. They map to Fibonacci extensions (projection tools built from prior moves).
Earlier targets appear in the previous rally forecast.
QNT Breakout and Breakdown Levels
A QNT breakout needs a daily trade above $372.24. Breakdown risk starts below $151.25.
Between them sits a wide zone. And zones like that invite volatility.
Project Agora Catalyst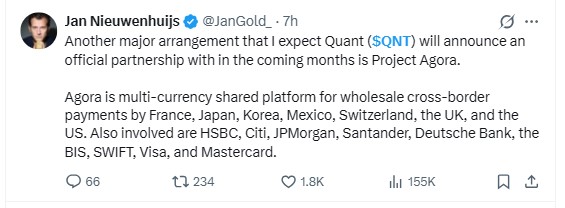
Analyst Jan Nieuwenhuijs expects a Quant partnership with Project Agora within months, per his X post. Agora targets wholesale cross-border payments.
Expectation, not announcement. Unconfirmed.
Social Sentiment
Hype followed. A viral X post claimed a new US financial system is imminent.
Unverified. Basically, euphoria marks late moves more than early ones.
Quant Price Prediction 2026
Quant price prediction 2026 has three paths by year-end. Bull: a daily trade above $372.24 targets $564.90. Base: a range between $151.25 and $372.24.
Bear: Losing $151.25 opens $52.09. Catalysts sit on the coin events calendar.
$QNT 7-Day Forecast
Bull: a retest of $320 to $372.24. Base: chop between $200 and $300. Bear: a $151.25 test.
$QNT 30-Day Forecast
By October 28, 2026, bulls need a daily trade above $372.24, targeting $564.90. Base: $180 to $320.
Bear: $151.25 breaks. That's the invalidation.
$QNT 60-Day Forecast
By November 27, 2026, the base range widens to $150 to $370. Bull keeps $564.90 in play.
Bear: If $151.25 fails, $52.09 opens.
$QNT October Price Forecast
October's full-month range: $151.25 to $372.24. Base sits near $200 to $300.
A daily trade below $151.25 invalidates it.
$QNT Price Target
Stance: the near-term $QNT price target is lower. A 299% week rarely holds in a straight line.
At first, the setup seemed like a clean breakout. Actually, scratch that: it's a vertical spike, and spikes retrace.
Can $QNT Reach $300 or $500?
$300 needs about 18.3% more. Market cap would hit $3.62 billion on 12.07 million circulating supply.
But $500 needs about 97.1% more, with a market cap near $6.04 billion. And that means clearing the $428.38 all-time high from September 11, 2021.
Retail chasers scan crypto airdrops meanwhile.
Market Risks
Bitcoin weakness hits recent winners hardest. And volume spikes fade fast.
Traders track latest crypto news for shifts.
Regulatory Risk
Rules on tokenized deposits (bank deposits recorded on blockchains) could slow rollouts. Traders follow AI-linked crypto news for signals.
Prediction Accuracy
Every forecast here is a scenario, not a promise. We've seen two things flip setups fast: liquidity and Bitcoin direction.
Traders comparing new launches check presale and IDO listings.
$QNT Trader Takeaway
Bullish above $372.24. Bearish below $151.25.
Support: $151.25 and $52.09. Resistance: $372.24 and $564.90.
Here's the thing: momentum and exhaustion are both real. Main risk: overbought RSI meeting a pullback.
Disclaimer
This article is for informational purposes only and doesn't constitute financial, investment, or trading advice. Crypto assets, including $QNT, carry high volatility and risk.











.webp)





