Will the RTX Price Climb or Slide After the Remittix Presale?


Remittix Presale Stage Reaches 98.29% With 11 Days on the Clock
The Remittix Presale dashboard shows RTX at $0.28 with 98.29% of the current stage sold, while the launch countdown reads 11 days and about 4 hours.
That puts trading on November 24, 2026, the date the project has already confirmed. This Remittix price prediction looks at the shape of the path after that date, not only the starting level.
Latest dashboard readings:
Share sold this stage: 98.29%
Amount collected: $33,432,947.50 of $36,000,000 (92.87%)
Remaining to target: $2,567,052.50, or 7.1%
Final-stage figure: $0.46
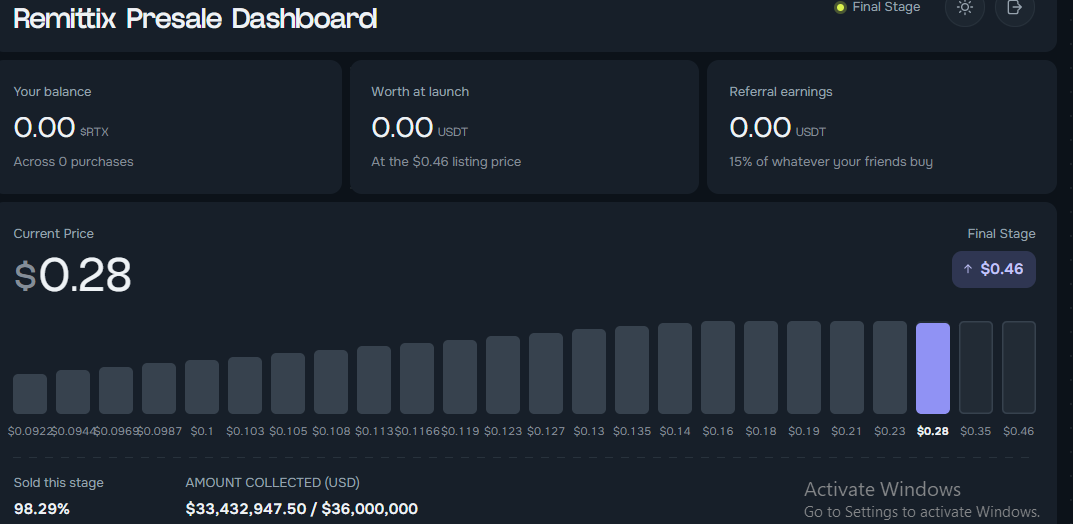
Source: Official Dashboard
Countdown Clock: What 11 Days Leaves Before the First Trade
Until the clock ends, the dashboard is the only reference. After it, trading sets the value, so the useful question is how RTX behaves over several checkpoints rather than on a single day. The table sets those checkpoints for the Remittix Presale cycle.
Checkpoint | Date | What It Tests |
Launch day | Nov 24 | Opening level and early demand |
Week one | Dec 1 | Whether the opening level holds |
Month one | Dec 24 | Whether demand lasts beyond early traders |
Trajectory Shapes: Four Paths RTX Could Follow After Launch
Each scenario lists a level at each checkpoint, with the gain or loss for buyers at $0.28 in brackets.
The scenarios combine the dashboard’s $0.46 figure with common behavior of newly traded tokens, so they are scenarios, not forecasts.
Path | Launch Day | Week One | Month One |
Spike and fade | $0.54 (+92.9%) | $0.42 (+50.0%) | $0.34 (+21.4%) |
Steady climb | $0.44 (+57.1%) | $0.50 (+78.6%) | $0.58 (+107.1%) |
Range-bound | $0.47 (+67.9%) | $0.44 (+57.1%) | $0.45 (+60.7%) |
Slide | $0.36 (+28.6%) | $0.30 (+7.1%) | $0.26 (-7.1%) |
The Remittix Presale ladder ends at $0.46, so a launch-day level above it would mean the market values RTX higher than the last dashboard figure.
Scenario Triggers: What Each Shape Needs to Happen
Spike and fade: heavy early buying lifts RTX above $0.46, then profit-taking pulls it back.
Steady climb: volume holds after the opening hours, and sell orders stay thin.
Range-bound: buyers and sellers balance near the final-stage figure.
Slide: early sell-offs outweigh demand, and weak crypto market sentiment adds pressure.
Earlier buyers in the Remittix Presale hold the largest paper gains, so supply from them can arrive before steady demand does.
That is why Spike and fade sits on the table even though it is not the most optimistic ending.
Signals to Track: Volume, Order Books, and Market Mood
Three signals would help separate the shapes in the opening days:
Signal | Supports Climb or Range | Supports Slide |
Trading volume | Stays high after the opening hours | Drops sharply after the opening hours |
Order-book depth | Deepens near the final-stage figure | Thins quickly below it |
Crypto market mood | Steady or improving | Weakening around Nov 24 |
None of these can be read before trading starts, so the outcome stays open until the first sessions provide data.
Risk Checks: Where the Trajectory Model Can Fail
Shape overlap: real trading can switch between shapes within hours, so one label may not fit.
Thin order books: day-one liquidity can widen swings in either direction.
Stage completion: the dashboard may reach its target before launch, which would remove the last dashboard reference.
Single-day bias: a strong or weak opening can distort how later checkpoints are read.
The Remittix Presale dashboard cannot show how these risks play out, since it records only stage levels. Any scenario should therefore be reviewed against live trading data once it exists.
Outlook: Levels and Dates Through the End of 2026
Nov 24: trading begins, with $0.46 as the main reference
Dec 1: week-one close, to compare against $0.42 and $0.50
Dec 24: month-one check, where the scenarios separate between $0.26 and $0.58
A week-one close above $0.46 would favor the steady-climb and range-bound shapes for the Remittix Presale, while a close near $0.30 would point to a slide.
YMYL Disclaimer: This article is for informational and educational purposes only and should not be taken as financial or investment advice. Crypto markets are volatile, and the price scenarios here are estimates, not guarantees. Readers should do their own research before making any decisions.