SpaceX Stock Drops 4.21% After FAA Review: Will SPCX Fall to $150?


SpaceX stock slipped 4.21% on Tuesday and closed at $156.54. The drop came after the FAA said it would review a plan to expand launch and landing work at Starbase in South Texas.
Now traders are asking if SPCX can hold the $150 area. This SPCX prediction looks at the news, the numbers, and the chart.
Why Is SPCX Stock Down Today?
SPCX closed $6.88 below its previous close of $163.42. It opened at $161.98 and never got back there. The day's range was $156.11 to $161.98.
The stock fell fast in the first hour, then moved sideways near $157. Volume was 68.4 million shares, below the average of about 94.4 million.
An AI-related trade has also been unwinding this week. That has erased most of the gains made since early October.
SpaceX Stock News: What Is the FAA Starbase Review?
The FAA will prepare an environmental impact statement and hold public hearings on the Starbase proposal.
The company wants up to 456 launches and 912 landings a year. That is well above its current authorization.
Reviews like this take time, and the result is not known. The company also expects Starship to support its broadband and AI businesses, so the outcome matters beyond Texas.
Talk of AI and telecom spectrum has grabbed headlines, but ISS cargo supplies on Tuesday were a reminder of the core space work.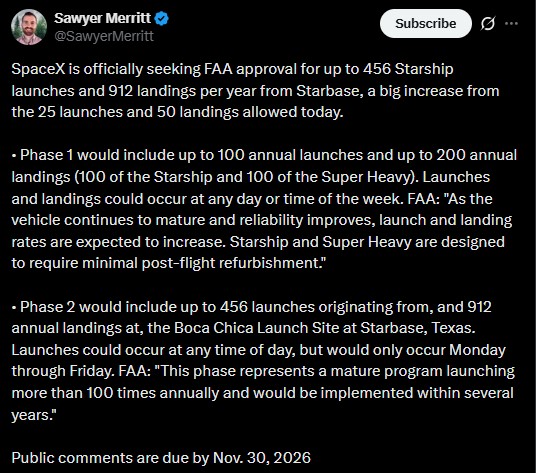
What Is the SpaceX Share Price Today?
Metric | Value |
Close (4:00 PM EDT) | $156.54 |
Daily change | -$6.88 (-4.21%) |
Overnight price (11:48 PM EDT) | 158.27(+1.73, +1.11%) |
Previous close | $163.42 |
Open | $161.98 |
Day's range | $156.11 - $161.98 |
Bid / Ask | $156.11 x 12,000 / $158.22 x 200 |
52-week range | $104.83 - $225.64 |
Market cap (intraday) | $2.063 trillion |
Volume | 68,438,228 |
EPS (TTM) | -1.10 |
Next earnings date (est.) | November 3, 2026 |
1-year target estimate | $221.26 |
The price is about 30.6% below the 52-week high and about 49% above the 52-week low.
EPS is negative, so there is no PE ratio.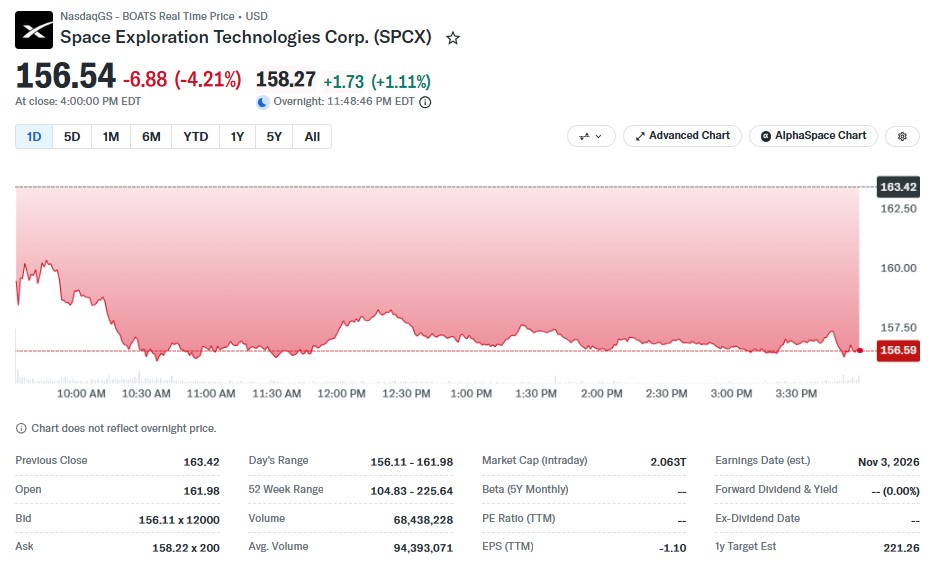
SPCX Technical Analysis: Where Are Support and Resistance?
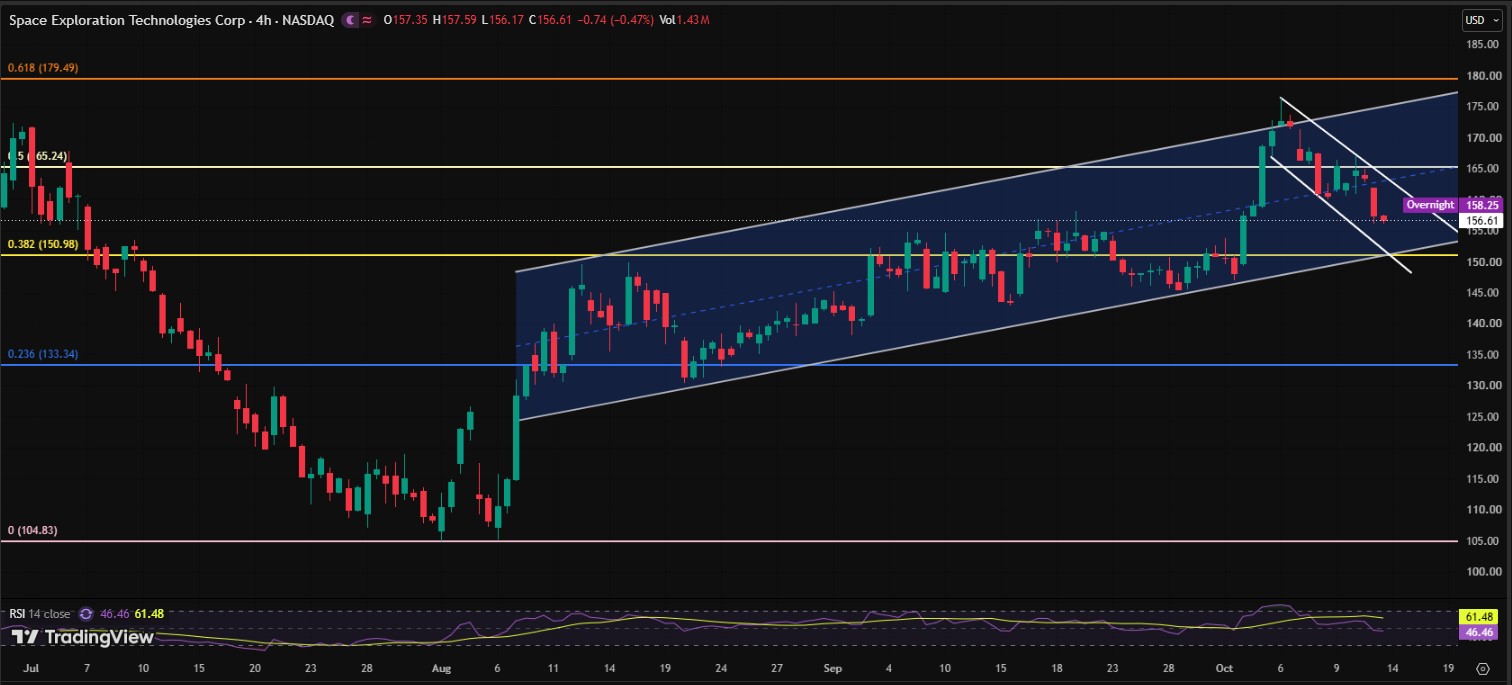
The 4-hour chart shows a wider ascending channel and a short-term falling channel. The first points to a bullish trend. The second shows a pullback after rejection near $172 to $176.
RSI is near 46. That shows weaker bullish momentum, not a clear sell signal.
Level | Price | What it means |
Resistance zone | $172 - $176 | Area where price was rejected |
Upside target | $179.49 | Possible target after a breakout |
Reclaim level | $165 | Needed to break the falling channel |
Support zone | $150 - $153 | Lower edge of the ascending channel |
Downside targets | $145 and $133.34 | Possible levels if $150 breaks |
SPCX Stock Forecast: How Low Can It Go, and Can It Recover?
Price is near $156.61 on the chart. The short-term view stays neutral to bearish while the falling channel holds.
Scenario | Trigger | Targets | Move from $156.54 |
Bullish | Reclaim $165 and break the falling channel | $172, then $179.49 | +9.9%, then +14.7% |
Neutral | Price stays between $150 and $165 | Sideways range | About -4.2% to +5.4% |
Bearish | Close below $150 | $145, then $133.34 | -7.4%, then -14.8% |
A move back above $160 to $165 would ease the pressure. A drop below $150 would hurt the bigger bullish structure.
None of these levels are guaranteed.
What Is the SPCX Price Target?
The 1-year target estimate is $221.26, about 41% above the latest close. Targets are estimates and can change fast.
Is SPCX Stock a Buy Right Now?
Nobody can say for sure. The stock is down, but the longer chart still shows an ascending channel.
Risks include negative EPS and a slow FAA review. Do your own research first.
Disclaimer
This article is for information only. It is not financial, investment, or trading advice. Stock prices can move fast, and you can lose money. Always do your own research and speak with a licensed financial advisor before making any investment decision.

















