SpaceX Stock Price Today: Will SPCX Go Up or Down From $160 Support?


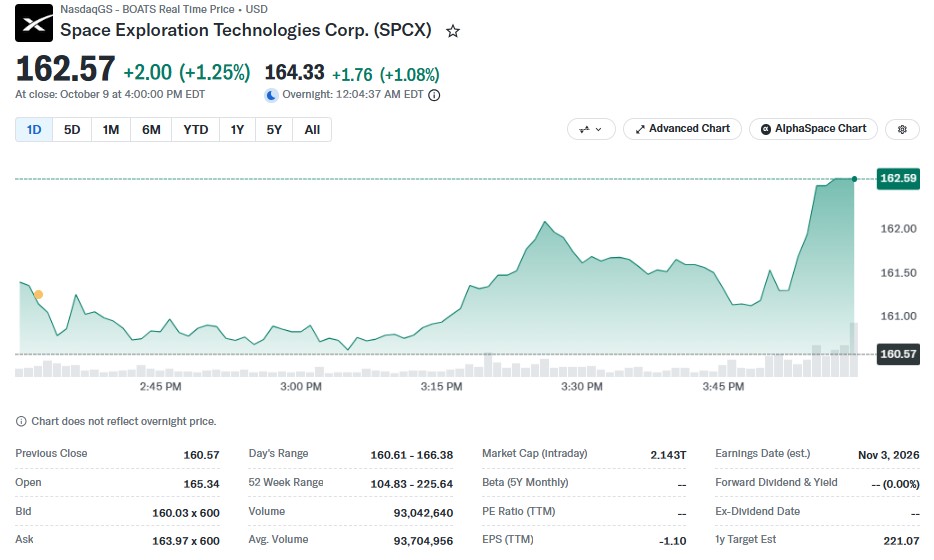
SpaceX stock is back at a key test after a sharp run higher. SPCX closed at $162.57 on October 9, up 1.25% for the day.
The stock is retesting its recent breakout. Many traders now watch $160 as the line that matters most.
If it holds, $170 to $175 comes into play. If it breaks, the setup gets weaker.
SpaceX Stock News: Why Is SPCX Moving Today?
The company bought wireless spectrum to expand its Starlink Mobile service. The deal points to a bigger push into telecom.
Wall Street noticed. The latest SPCX news also hit carrier shares, including AT&T (T) and Verizon (VZ).
The deal gave SpaceX a short-term lift. An FCC decision is pending.
What Is the SpaceX Share Price Today?
Metric | Value |
Close (Oct 9) | $162.57 (+1.25%) |
Overnight price | $164.33 (+1.08%) |
Previous close / Open | $160.57 / $165.34 |
Day's range | $160.61 to $166.38 |
52-week range | $104.83 to $225.64 |
Volume (avg) | 93.04M (93.70M) |
Market cap | $2.143T |
EPS (TTM) | -1.10 |
Earnings date (est.) | Nov 3, 2026 |
1-year target estimate | $221.07 |
SPCX Price Analysis: What Do the Charts Say?
On the 4-hour chart, price sits above the 20 EMA at $160.11. The 50 EMA is at $154.09, and another line sits near $150.14.
RSI reads 56.49. That is neutral, not overheated.
Price has moved inside a rising channel since early August. It touched the top near $175 and pulled back.
The 4-hour Fib levels sit at $150.98, $165.24, and $179.49. The 0.5 level at $165.24 capped the latest bounce.
The 8-hour chart shows an Elliott Wave count. Wave 1 sits at the recent peak, and wave 2 is the pullback. Price is above a cloud, with the cloud line at $148.74.
The weekly chart looks weaker. Price fell back inside the 2-month channel after a rejection at the 0.618 log Fib level.
That left a long upper wick and a shooting star shape, which is not bullish.
This is a very young chart. Patterns are hard to trust, so confirmation matters.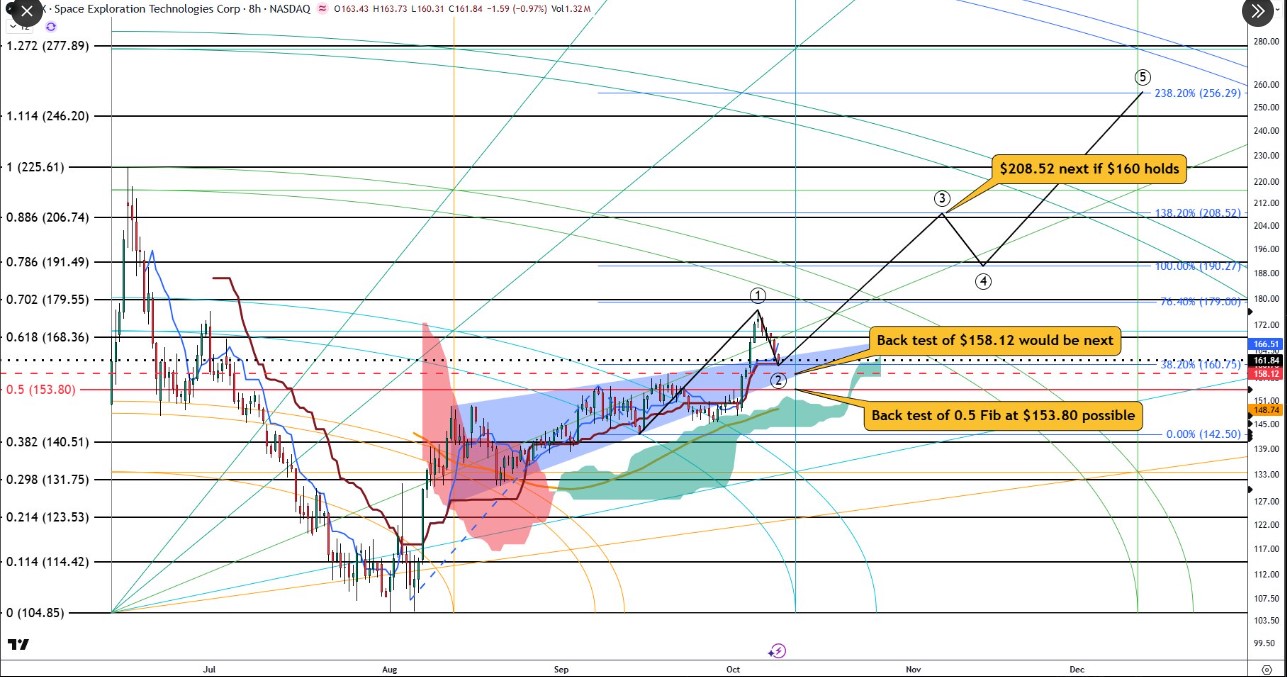
What Is the Support Level for $SPCX Stock?
Price | Level | Note |
$160.75 | 38.2% Fib | Pivot |
$160 | Round number | Key level to hold |
$158.12 | Chart level | Possible backtest |
$153.80 | 0.5 Fib | Major support |
$148.74 | Cloud line | Below current price |
$140.51 / $142.50 | 0.382 Fib / 0.00% extension | Deep support |
$104.85 | Low point | Chart base |
The bullish case needs the $153.80 to $158.12 zone to hold.
What Is the SPCX Stock Forecast and Price Target?
Price | Level | Type |
$168.36 | 0.618 Fib | Resistance |
$179.55 | 0.702 Fib | Resistance |
$179.00 | 78.4% extension | Target |
$190.27 | 100% extension | Target |
$208.52 | 138.2% extension | Target |
$256.29 | 238.2% extension | Long-term target |
The wave path on the 8-hour chart points to $208.52 first. Then a dip near $190.27, and a longer reach toward $256.29.
That is one count, not a promise. This $SPCX stock forecast leans cautiously bullish only while support holds.
Is SpaceX Stock a Buy Right Now?
The bullish side wants $160 to hold. A bounce could open the way to $168.36 and then $179.
The bearish side: a sustained break below $153.80 would weaken the setup.
Wall Street's 1-year target estimate is $221.07, about 36% above the close.
Will SPCX Stock Go Up or Down? SpaceX Stock Prediction
The spectrum deal gave a short-term lift. But the weekly rejection near the 0.618 level is a warning sign.
Watch $158.12 and $153.80 first. Then watch $168.36 for a breakout attempt, and the SPCX price after the FCC decision.
Disclaimer
This article is for information only. It is not financial or investment advice. Stock prices can fall fast, and you can lose money. Chart levels and targets are not guarantees. Do your own research and consult a licensed financial advisor.

















