SUI Price Prediction: SUI Building a New Long-Term Structure?


A trader says SUI is starting to build a new long-term structure after recovering from its 2026 lows, with a path of targets running from $1.92 up to $5.34.
This SUI Price Prediction checks that framework against the chart, with $1.1004 the level to hold right now.
SUI News: A Trader Lays Out a Multi-Stage Recovery Path
A social media post from Giannis Andreou said SUI is starting to build a new long-term structure, trying to recover from its 2026 lows.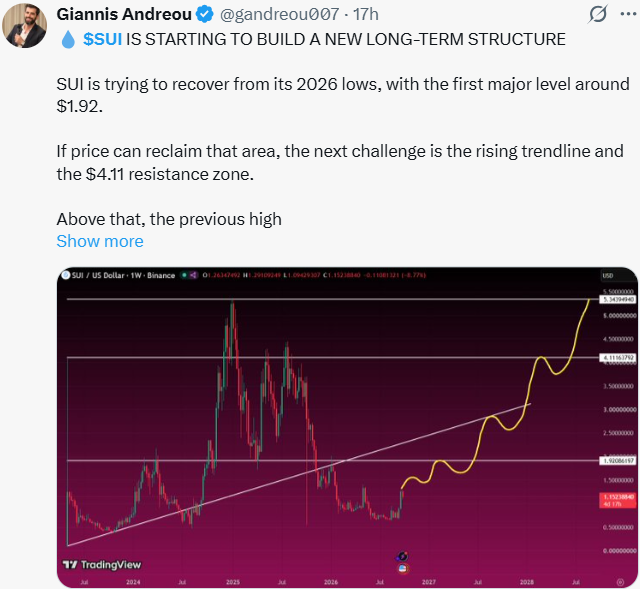
He pointed to $1.92 as the first major level to reclaim. If SUI can clear that, he said the next challenge is the rising trendline and a $4.11 resistance zone, and above that, the previous high near $5.34 becomes the key level, with a clean break there opening the door for a much bigger move.
This is one trader's view built on a step-by-step framework rather than confirmed analysis, and the targets sit well above what's currently marked on the shorter-term chart below.
CoinGabbar could not independently verify the $5.34 prior-high figure from the post alone.
SUI Price Prediction Chart: Technical Analysis
This chart tells a longer story. SUI fell from around $1.30 in May to a low near $0.85 by August, a steady decline of more than a third.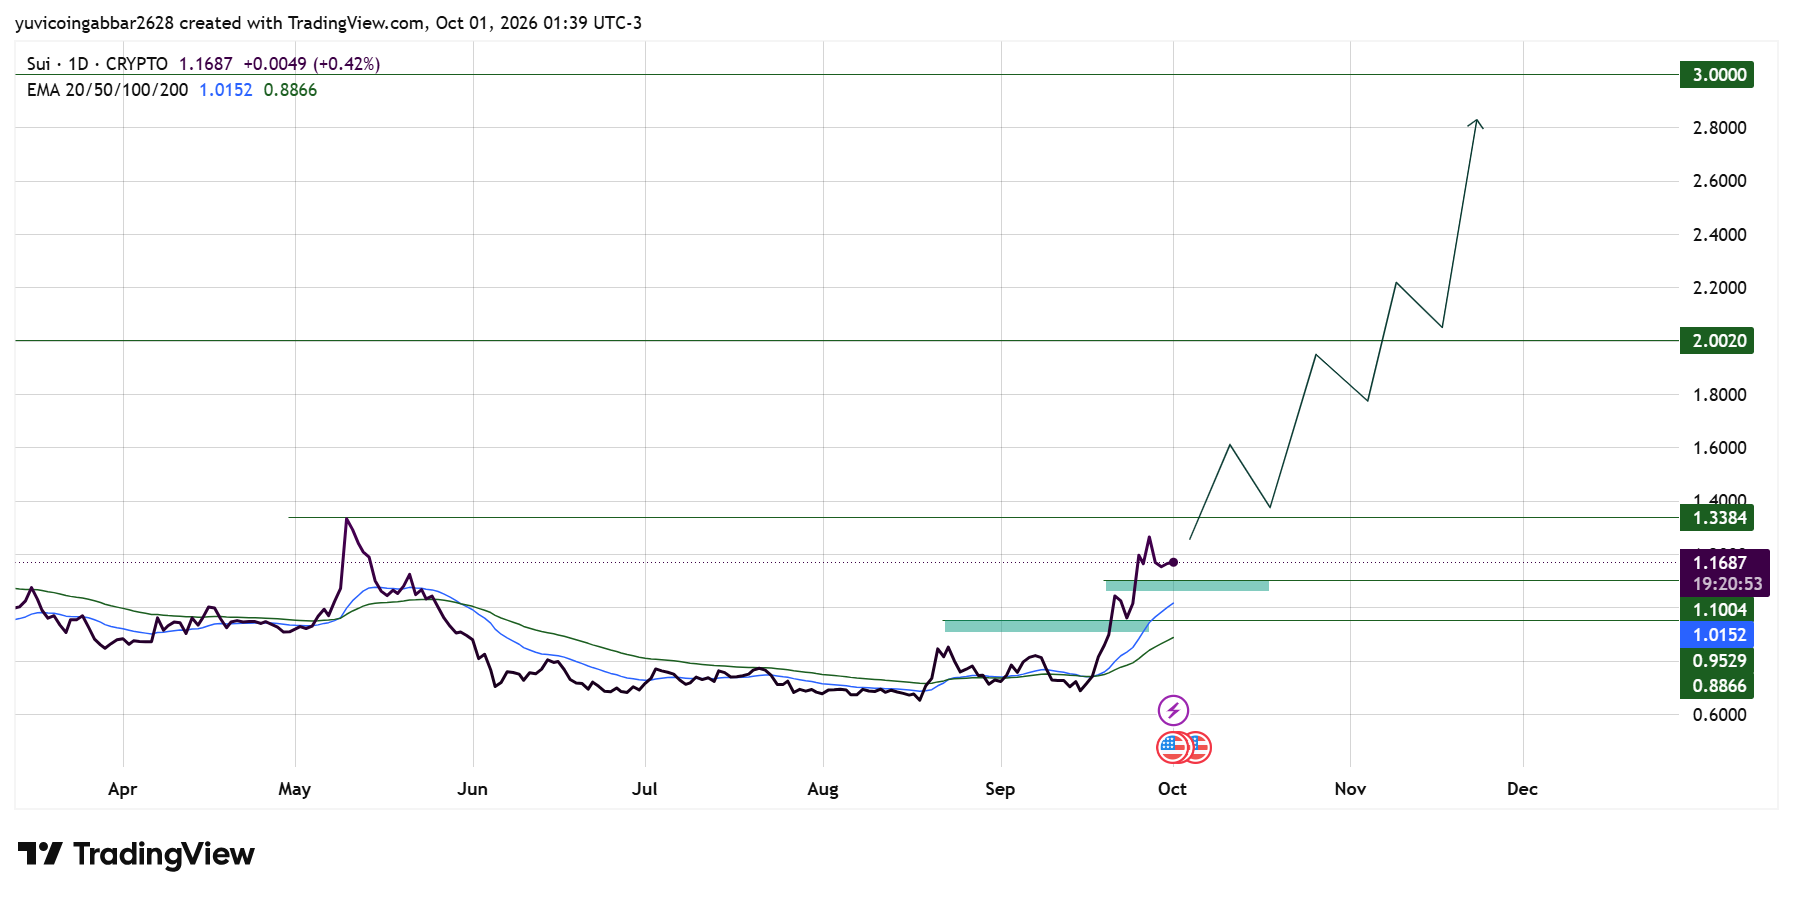
Since then, SUI has recovered, with a sharp spike in late September taking the price to a high near $1.21 before settling. SUI price today is $1.1687, up 1% on the day.
Both EMAs sit below the current price and have turned upward.
The 20 EMA is at $1.0152 and the 50 EMA at $0.8866. The teal zone between roughly $1.10 and $1.17 marks a support band from the recent climb, with $1.1004 as the first real test if this bounce pulls back.
SUI Outlook Key Support and Resistance Levels
Level Type | Price |
Resistance 3 | $3.0000 |
Resistance 2 | $2.0020 |
Resistance 1 | $1.3384 |
Immediate Price Reference | $1.1687 |
First Confirmed Support | $1.1004 |
SUI Forecast
Bull case: If the price holds at $1.1004, SUI's recovery from its 2026 lows stays intact, and a close above $1.3384 would be the next technical step.
That would line up with the early stages of the longer-term structure described in the trader's post, though $1.92 and the targets above it sit beyond what's marked on this chart.
Bear case: A close below $1.1004 would risk a slide back into the EMA zone between $1.0152 and $0.8866.
Given how sharp the recent spike was, some pullback into that zone wouldn't be unusual after such a fast move.
SUI Price Prediction: Can SUI Reach $5.34?
Nothing on this daily chart is marked that high; the chart's own highest level is $3.0000. The $5.34 figure comes from the trader's post, which frames it as a long-term target reached only after clearing $1.92 and then $4.11 first.
Treat it as a multi-stage, long-range view rather than something the current chart confirms.
SUI Price Prediction 2026: Expert View
According to CoinGabbar analysts, SUI's bounce off its 2026 lows is a real, chart-visible move, and holding $1.1004 would support the idea that a longer-term recovery is underway.
The trader's framework gives that recovery a structured path with named levels, which is a step above vague hype, but $1.92 is still a long way from where SUI trades today.
The level that matters for now is $1.1004, not the full multi-stage target list.
Disclaimer
This piece is for informational purposes only and isn't financial advice. The levels and scenarios above are based on technical chart analysis and publicly available data at the time of writing. Crypto markets can move sharply within hours, so past patterns don't guarantee future outcomes. Do your own research and consider your risk tolerance before acting on any level discussed here.











.webp)










