Shiba Inu Price Prediction October 2026: Can SHIB Hold Its Breakout?


The Shiba Inu Price Prediction October 2026 outlook opens with a familiar contrast. September burns were active, and $SHIB is edging higher, yet the token still trades more than 90% below its 2021 all-time high.
Shiba Inu (SHIB) launched in August 2020 as an Ethereum-based meme token and later added its own layer-2 network, Shibarium.
The Shiba Inu price today is $0.00000582, up 0.9% in 24 hours. The Shiba Inu coin ranks 36th by market value, with a market cap of $3.431 billion and 24-hour trading volume of $90.883 million.
Live SHIB Market Data
Metric | Value |
Price | $0.00000582 |
24h Change | +0.9% |
24h Range | $0.00000570 to $0.00000598 |
Market Cap | $3.431B |
Source: market data taken from CoinGecko, as of Oct 1, 2026. Figures may vary slightly across other tracking websites.
Perpetual futures open interest is larger than daily spot volume, so leveraged trades can amplify a weekly move.
Shiba Inu News Today: September Burn Report
Shibburn's report on the top 10 SHIB burners shows 432,839,551 $SHIB removed from circulation in September 2026. 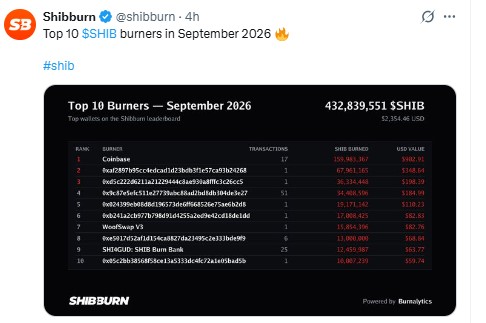
Source: Data Taken From @Shibburn on X, October 1, 2026
Coinbase led the list with about 160 million $SHIB across 17 transactions.
The total is below 0.0001% of the 589.239 trillion circulating supply, so burns alone cannot change the supply picture quickly.
Shiba Inu Technical Analysis: Weekly Channel Breakout
On the weekly chart, $SHIB has moved above the upper boundary of the channel that guided price lower through 2026.
It is now testing that boundary from above. The current weekly candle opened at 0.00000592 and trades at 0.00000582, so it is red for now. 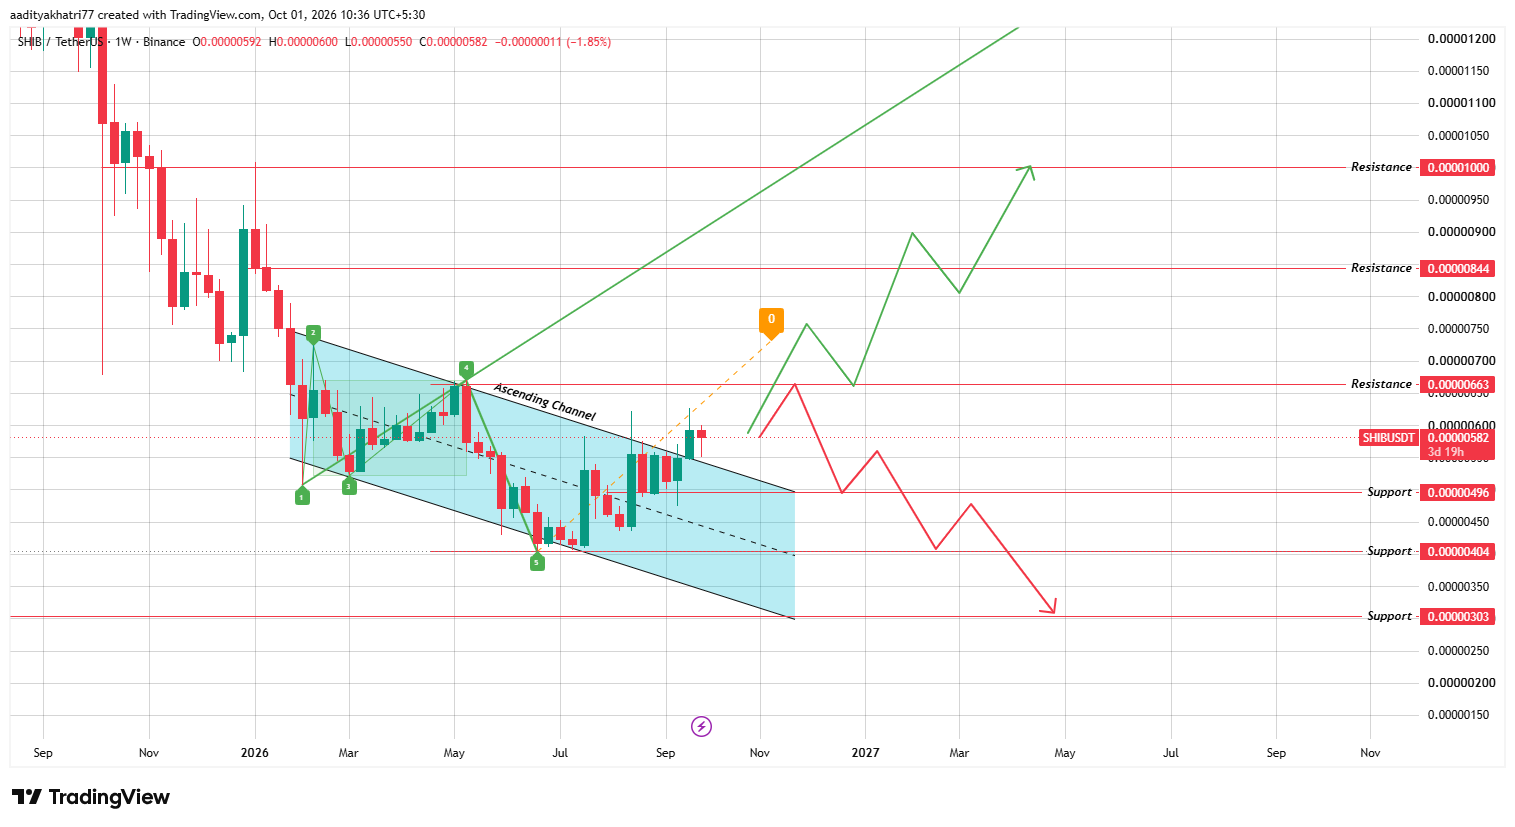
Source: Chart Taken From TradingView, Binance SHIBUSDT 1W chart, captured at 10:36 AM IST (UTC+5:30), October 1, 2026
It closes on Monday, October 5, at 5:30 AM IST (00:00 UTC), and every level here refers to weekly closes.
The Wolfe wave drawn from the February to June swings leans bullish.
Its extended line points toward the 0.00001000 resistance late in 2026. That is a projection, and it only stays relevant if the breakout holds.
Shiba Inu Price Prediction October 2026: Can SHIB Reach $0.00000663?
Buyers first need the weekly candle to turn green, which means a close above its 0.00000592 open. They also need volume above the average of the previous 20 weekly candles.
A close above $0.00000663 on that volume would be the next confirmation, about 13.9% above the current price.
Beyond that, the chart targets $0.00000844, roughly 45.0% higher, and then 0.00001000, near 71.8% higher. The green path expects pullbacks to retest broken resistance after each leg.
What Happens If SHIB Is Rejected at $0.00000663?
If sellers defend 0.00000663, $SHIB would likely drift back toward $0.00000496, about 14.8% lower.
That level sits close to the channel boundary, so a weekly close below it would cancel the breakout and weaken the Wolfe wave projection.
The chart then shows lower steps at $0.00000404, about 30.6% below the current price, and $0.00000303, near 47.9% lower.
Price Levels to Watch
Support | Resistance |
$0.00000496 | $0.00000663 |
$0.00000404 | $0.00000844 |
$0.00000303 | $0.00001000 |
Bull, Base, and Bear Scenarios
Scenario | Setup | Level |
Bull | Green weekly close above $0.00000592, then a close above $0.00000663 on above-average volume | $0.00000844, then $0.00001000 |
Base | Price holds near the channel boundary without a decisive weekly close | $0.00000496 to $0.00000663 |
Bear | Rejection at $0.00000663, then a weekly close below $0.00000496 | $0.00000404, then $0.00000303 |
SHIB vs Bitcoin
SHIB gained 0.9% against the dollar and 0.1% against Bitcoin over 24 hours, which suggests Bitcoin rose about 0.8%.
SHIB tends to follow Bitcoin's direction with wider swings, so a weak BTC could undermine a weekly breakout attempt.
Any Shiba Inu price prediction should track Bitcoin alongside the levels above.
Methodology
This Shiba Inu price prediction October 2026 uses the weekly Binance SHIBUSDT chart from TradingView, captured at 10:36 AM IST on October 1.
Levels come straight from that chart, and every percentage distance is measured from its 0.00000582 price.
Market data comes from CoinGecko, and burn figures come from the Shibburn post shown above.
Expert Opinion
General market commentary on SHIB keeps returning to burns, yet the September total is tiny against the supply.
For this Shiba Inu price prediction, the weekly close matters more. A confirmed close above the channel boundary and then above $0.00000663 would carry more weight than any single burn report.
Disclaimer: This article is for information only and is not financial advice. Shiba Inu is a highly volatile asset, and a weekly close below $0.00000303 could lead to deeper losses. Wolfe waves and channel breakouts fail often, and no probability can be assigned to any scenario here. You can lose part or all of your capital, so do your own research before making any decision.











.webp)










