TMC3 Breakout Alert: Can Altcoins Really Surge 9.3X to $7.5 Trillion?


A new TMC3 price prediction is getting attention on crypto X. Analyst Egrag Crypto says the total altcoin market cap, without Bitcoin and Ethereum, is forming a big ascending triangle on the monthly chart.
His target is $7.5 trillion. That is about 9.3 times higher than current levels.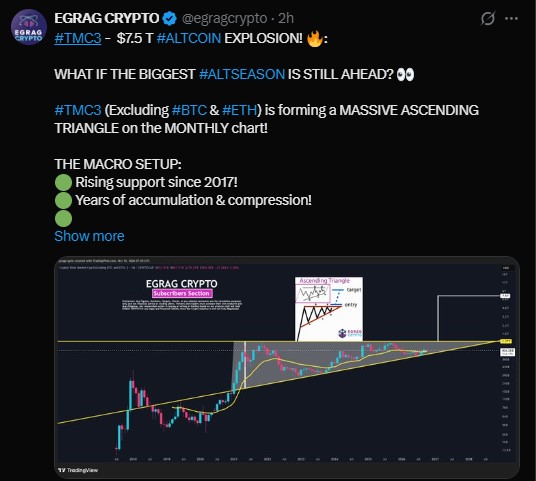
Big claim. Let's look at the numbers behind it.
What Is TMC3 in Crypto?
TMC3 is the total market cap of all crypto assets except Bitcoin (BTC) and Ethereum (ETH). It works like TOTAL3 on TradingView.
Traders use it to track altcoins as one group. When it rises, smaller coins are usually doing well.
TOTAL2 is similar, but it only removes Bitcoin. So it still includes Ethereum.
What Is the TMC3 Price Target for Altseason?
The post points to an extended macro target of $7.5 trillion. It says this is roughly 9.3X from current levels.
Work it backward, and the current TMC3 value is near $806 billion. That is our own estimate from the author's numbers, not a label read from the chart.
Here are the main levels:
Level | Value | What It Means |
Implied current TMC3 | About $806B | $7.5T divided by 9.3 |
Breakout trigger | Monthly close above $1.14T | The analyst's confirmation signal |
Breakout resistance | $1.17T | Flat top of the triangle |
Gain needed to reach $1.14T | About 41% | From $806B |
Gain needed to reach $1.17T | About 45% | From $806B |
Extended macro target | $7.5T | Long-term chart projection |
Is TMC3 Forming an Ascending Triangle?
On the monthly chart, there is a flat resistance line near $1.17T. Below it, a rising trendline connects the lows going back to 2017.
That shape is called an ascending triangle. Buyers keep paying higher prices, while sellers defend one level.
The post calls this years of accumulation and compression. Compression just means the price range gets tighter over time.
The $7.5T figure is an extended projection. It is far above the triangle top, so it needs much more than a simple breakout.
What Confirms an Altcoin Breakout on the Monthly Chart?
The trigger is simple. TMC3 needs a monthly close above $1.14T. A quick wick above that level is not enough.
Monthly candles move slowly. That makes the signal rare, but also harder to fake than a daily break.
From about $806B, the market would need to rise roughly 41% to reach that trigger.
The post also says TOTAL2 and TOTAL3 are both forming macro ascending triangles. If all three confirm, the author says altseason could be historic.
That is his view. It is not a fact yet.
Is Altseason Still Ahead?
It is possible. Altcoins have rallied hard after long quiet stretches before, and tight ranges can lead to big moves.
But a pattern is not a promise. A triangle can break down as easily as it breaks up.
Altcoins also depend on Bitcoin's trend, money flow, and overall risk appetite. A weak market can stall any setup.
Nobody really knows if a move like 9.3X is realistic. It would need trillions of dollars in new money.
What Are the Risks of This TMC3 Price Prediction?
Here is what could go wrong:
Failed breakout: Price may poke above resistance and then fall back.
Strong resistance: The $1.17T zone has capped price before.
Slow monthly signal: It can take months to confirm or fail.
One analyst view: This is a single chart read, not a market consensus.
Readers should also check the other side. Some analysts think altcoins may keep losing ground to Bitcoin if big investors prefer safer assets.
Will Altcoins Reach $7.5 Trillion?
On paper, the setup is clear. Rising support since 2017, flat resistance at $1.17T, and a trigger at $1.14T.
Until a monthly close happens above that line, the $7.5T target is only an idea.
Watch the monthly candle, not the headlines.
Disclaimer
This article is for information only. It is not financial, investment, or trading advice. Crypto assets are very volatile, and you can lose all of your money. Price targets and chart patterns are opinions, not guarantees. Do your own research and speak with a licensed financial advisor before making any decision.

















