VeChain Price Prediction: Can $VET 10X Next Rally?


$VET just dropped over 7% today, pulling the price down into a descending channel that's formed since early September's rally.
Trading volume also cooled slightly, down about 6% over the same period.
The price is sitting near $0.00746, right where the channel's lower boundary and a marked support level line up.
This VeChain price prediction checks whether that support holds or gives way to a deeper pullback.
Market data was checked on September 15, 2026, based on the chart timestamped 01:16 (UTC).
VeChain Price Prediction Today: Market Overview
Metric | Value |
Price | $0.0074557 |
Market Cap | $642.71M (-7.42%) |
Unlocked Market Cap | $648.15M |
24h Volume | $21.23M (-6.33%) |
Vol/Mkt Cap (24h) | 3.32% |
FDV | $648.15M |
Total Supply | 85.98B |
Max Supply | 86.71B |
Circulating Supply | 85.98B |
Source: Data from CoinMarketCap as of September 15, 2026, at 13:16 IST. Figures may vary slightly across other tracking websites.
VET Price Prediction Chart: Technical Analysis
Pair: VET/USD · Market: Spot · Timeframe: 1D · Timestamp: September 15, 2026, 04:16 UTC-3
VET trades at $0.0074557, trading inside a descending channel that formed after a sharp early-September rally.
Price is now testing the channel's lower boundary right where it lines up with the $0.0071633 support level.
The key point is that, to continue the trend, the price needs to hold the support level and break the channel in the upward direction.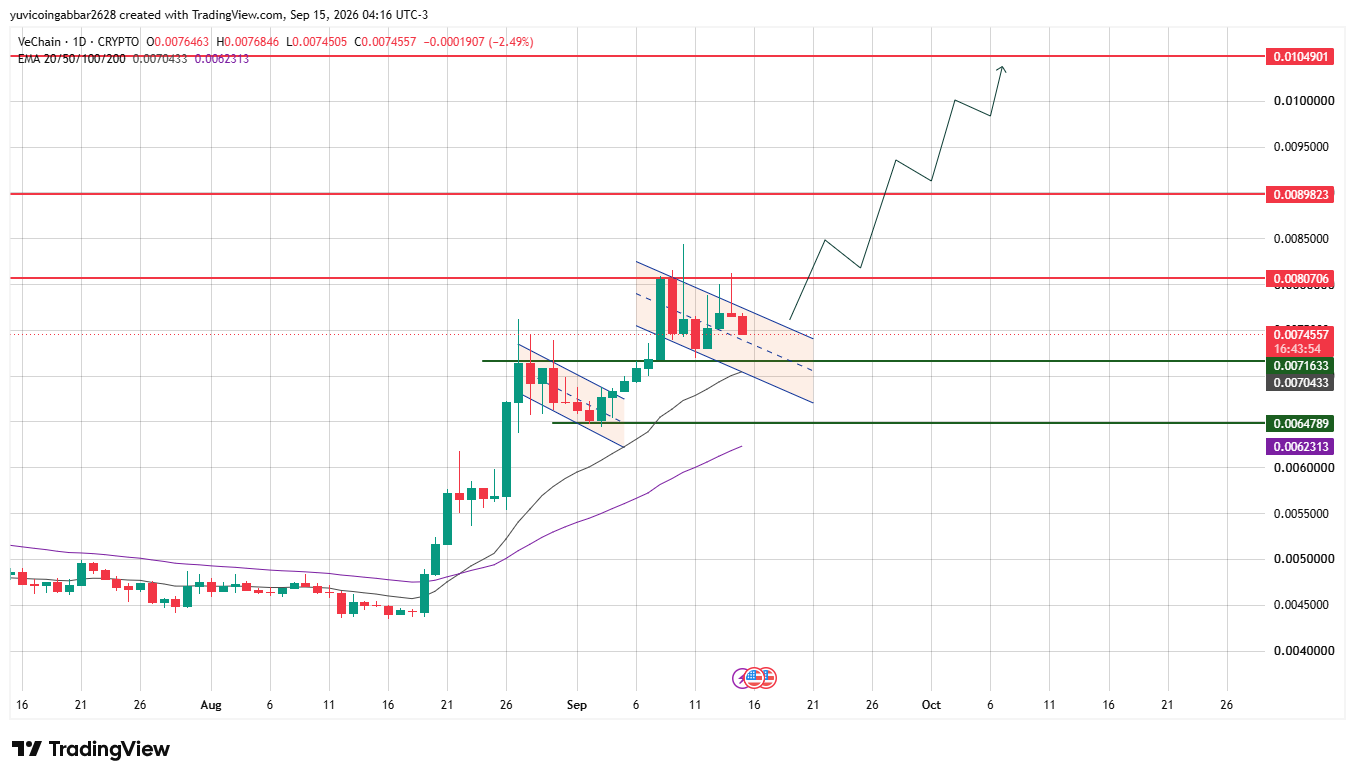
$VET Key Levels to Watch: Support and Resistance Outlook
Level Type | Price |
Resistance 3 | $0.0104901 |
Resistance 2 | $0.0089823 |
Resistance 1 (nearest) | $0.0080706 |
Immediate Price Reference | $0.0074557 |
First Confirmed Support | $0.0071633 |
Deeper Support | $0.0064789 |
VeChain Forecast: Bull Case vs Bear Case
Bull case: A bounce from $0.0071633 and a break back above the descending channel would open the path toward $0.0080706 and then $0.0089823 if momentum returns.
Bear case: A close below $0.0071633 would expose the EMA cluster near $0.0070433 and then the deeper support at $0.0064789, extending the current channel breakdown.
Can VeChain 10X? A Long-Term Look
A 10x from today's price would put $VET near $0.0746, with the market cap climbing toward roughly $6.4 billion, well above the highest resistance on the current chart at $0.0104901.
That's not a near-term technical setup; it's a multi-year scenario that would need sustained enterprise and supply-chain adoption to drive real demand, not just a bounce off support.
Possible over a longer horizon, but nothing in today's chart or data points to it happening soon.
$VET Triggers and Invalidation
Scenario | Trigger | Likely Outcome | Invalidation Point |
Channel bounce | Bounce from $0.0071633 | Push toward $0.0080706 | Close below $0.0071633 |
Support hold | Hold above $0.0070433 | Range continues near channel lows | Close below $0.0070433 |
Support breakdown | Close below $0.0070433 | Slide toward $0.0064789 | Reclaim of $0.0071633 |
VeChain Price Prediction: Can $VET Reach $0.0104901?
$0.0104901 is the highest resistance marked on the chart. Getting there would require VET to first clear $0.0080706, then $0.0089823, a multi-stage move that would need today's pullback to reverse cleanly first.
VeChain Price Prediction 2026: Expert View
According to CoinGabbar analysts, Today's drop has brought VET right to a key decision point, with channel support and a marked demand zone both sitting in the same area.
The $0.0071633 to $0.0080706 range is what matters most over the next few sessions.
Disclaimer
This piece is for informational purposes only and isn't financial advice. The levels and scenarios above are based on technical chart analysis and publicly available data at the time of writing, and crypto markets can move sharply within hours, so past patterns don't guarantee future outcomes. It's worth doing independent research and considering your own risk tolerance before acting on any of the levels discussed here.











.jpg)






