Velvet Price Prediction After a 30% Jump, Can Bulls Hold $0.07?


Can a token that's 96.5% below its peak hold a 30% bounce?
That's the question behind this Velvet price prediction. On Nov 18, VELVET broke out of a falling wedge, a squeeze between two down-sloping trendlines, and jumped from about $0.054 to $0.0777 in a single daily candle.
Earlier VELVET breakout coverage leaned on channels. This setup rests on a wedge, whale wallets, thin spot volume, and an extreme fear reading.
Velvet Price Prediction Today and the Data Snapshot
At 09:29 UTC on Nov 19, 2026, VELVET trades at $0.07224, up 30.57% in 24 hours. Rank is 411th.
CoinMarketCap data shows a market cap of $34.23M and a circulating supply of 473.85M, out of 1B total.
Spot volume hit $9.15M, up 243.3%.
And VELVET still trades 96.52% below its all-time high of $2.09, so this bounce starts from a deep hole.
Velvet Technical Analysis: How the Daily Chart Got Here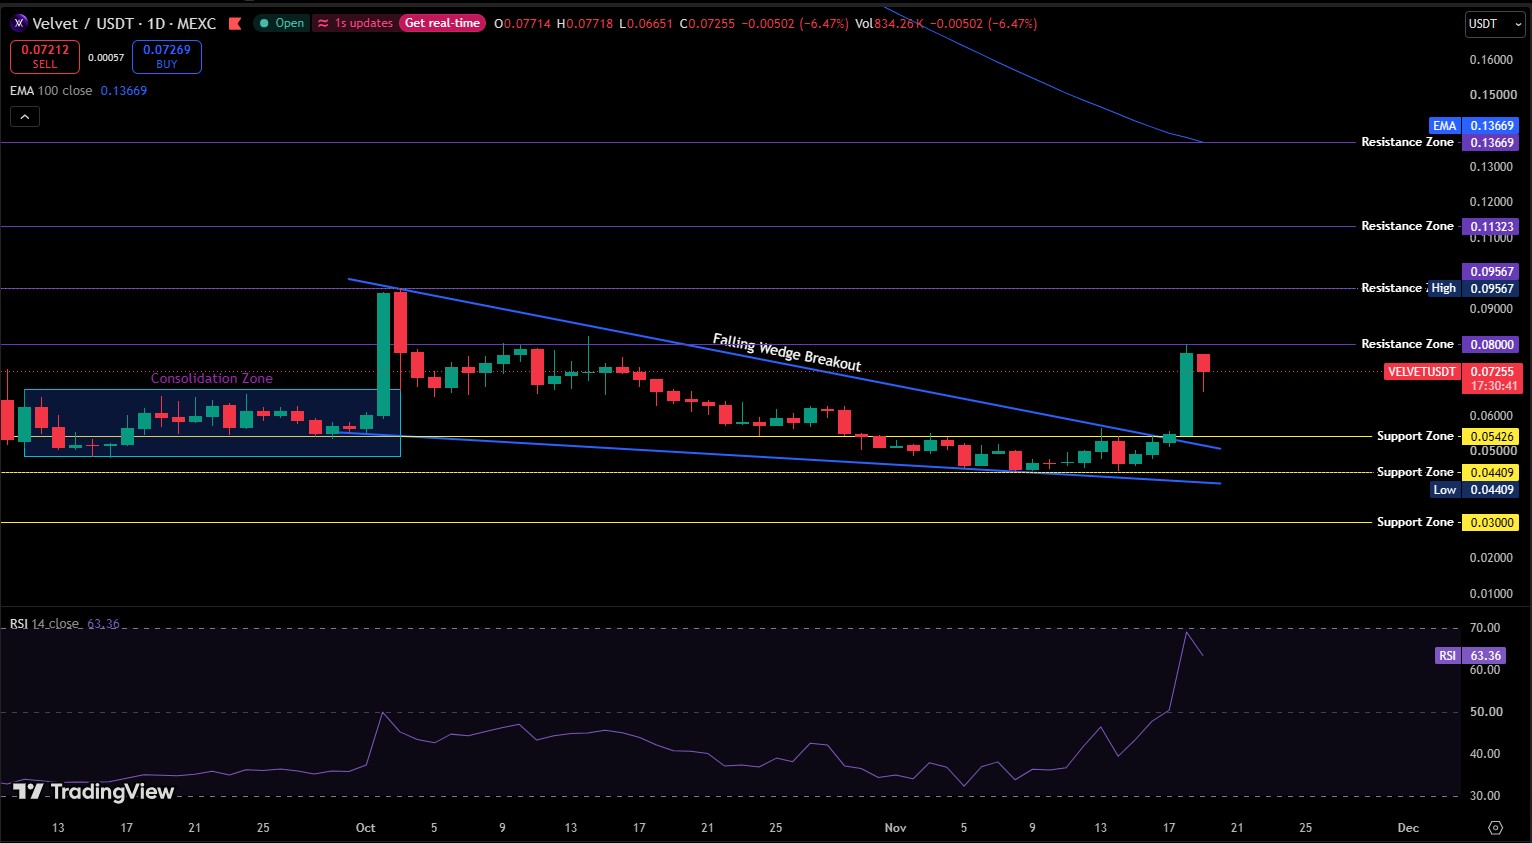
Velvet Price Analysis of the Sideways Range
Before Oct 2, the TradingView daily chart showed VELVET drifting in the consolidation zone between $0.050 and $0.067 for weeks.
This Velvet price analysis follows the MEXC VELVET/USDT pair. RSI hovered near 35 there.
Support, a price floor where buyers showed up before, sat at $0.05426. Near $0.067, sellers kept capping rallies, and that ceiling is called resistance.
The Spike and the Long Drift Lower
Oct 2, brought a tall green candle from about $0.06 to a high of $0.09567.
Each rally after that topped out lower, from $0.080 down to $0.055. That's the falling wedge taking shape.
RSI touched about 32 around Nov 5. And the price found itself low at $0.04409 around Nov 9, about 54% under the peak.
A previous ascending channel breakout post covers the earlier trend.
The Breakout and Today's Pullback
The price reached the upper wedge line near $0.054 on Nov 17. A day later came the falling wedge breakout, with RSI jumping from about 50 to 69.
Buyers ran straight into resistance at $0.08000 and stopped.
Nov 19 opened at $0.07714, dipped to $0.06651, then recovered to $0.07255. Buyers snapped it up fast. And if they keep defending $0.0665. Then $0.08000 is back in play.
Still, the EMA 100, an exponential moving average of the past 100 days of price, sits at $0.13669, 89% above today's price.
A similar sudden move is covered in why VELVET jumped before.
What Futures Traders Did During the Jump
Futures volume exploded, up 1,306.55% to $62.20M.
CoinGlass futures data shows spot volume at only $1.49M, so futures outran spot 41.7 times.
Open interest, the total value of live futures contracts, rose 65.07% to $12.28M. Binance holds $5.71M of it.
The funding rate, a fee that longs pay shorts when futures trade above spot, is 0.0239% every 8 hours. Longs are paying up.
At first glance, a short squeeze explains it. Shorts lost only $42.51K, far too little to lift a $34M token 30%.
The take buy/sell ratio, market buys against market sells, is 0.9388 on Binance, so sellers hit harder. But Binance accounts lean long at 2.3990.
Whale Wallets Hold Most of the Supply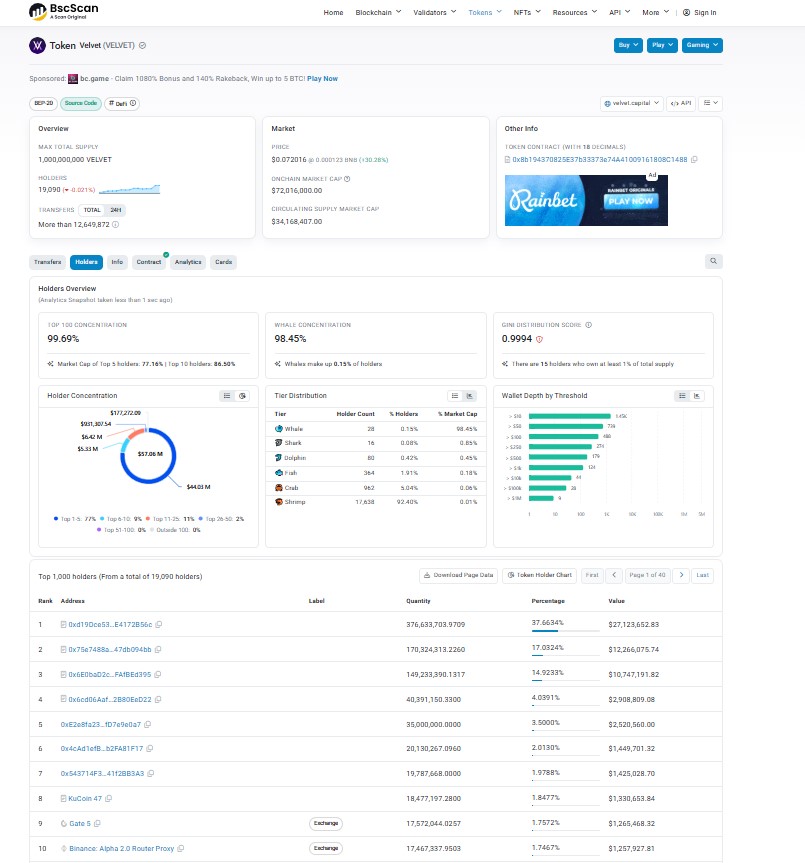
BscScan holder data lists 19,090 holders, and the top 100 wallets hold 99.69% of the supply.
Whale concentration, the share held by the biggest wallets, sits at 98.45%.
Wallet 1 alone holds 37.66% of supply.
Wallets 2 and 3 hold 17.03% and 14.92%. BscScan labels a few of them, so nobody outside the project can tell which ones are free to sell.
Whale risk shapes every Velvet price prediction here. So who's really buying a $34M token when 3 wallets own 69.6% of it?
Velvet Price Forecast Scenarios From Here
The price trades above $0.05426. But this Velvet price forecast expects a dip back toward $0.0665 before the price clears $0.08.
Scenario | Trigger | Target | Invalidation | Liquidity Condition |
Bullish | Hold $0.0665, clear $0.08000 | $0.09567, then $0.11323 | Trading under $0.05426 | Spot volume above $9.15M |
Base | Range between $0.0665 and $0.08000 | $0.07 to $0.08 | Break of either edge | Futures-led, thin spot |
Bearish | Loss of $0.0665, then $0.05426 | $0.05426, then $0.04409 | Reclaim of $0.08000 | Spot outflow, falling open interest |
Support and Resistance Levels to Watch
Support sits at $0.0665, $0.05426, $0.04409, and $0.03. Resistance sits at $0.08, $0.09567, and $0.11323, and the EMA 100 is at $0.13669.
Traders hunting more support and resistance setups can browse more crypto forecasts.
Velvet Price Outlook for the Next Week
For the next 24 hours, the Velvet price outlook favors a range between $0.0665 and $0.0777, and positive funding makes a hard flush less likely.
By week's end, trading above $0.08 on rising spot volume opens at $0.09567. And a slip under $0.05426 ends the wedge story.
A Velvet price projection for the month ahead runs from $0.04409 to $0.09567, wide because 3 wallets can move the chart alone.
Project news can hit a thin chart hard, so AI token news belongs on the watchlist.
Risks That Can Break the Setup
Fear and greed sit at 11, extreme fear, and spot net flow is negative $56.8K.
A listing or delisting can change liquidity within hours, so upcoming exchange listings are worth tracking.
If sellers push the price under $0.0665 again on thin volume. Then $0.05426 comes into play. This Velvet price prediction stays bullish only above it.
Disclaimer: This article is for information only and isn't financial advice. Crypto prices can drop fast, and readers should do their own research before trading.
















