Venom Price Prediction 2026–2030: Can VENOM Recover This Key Level?


$VENOM trades at $0.01724 as of September 21, 2026, 09:54 UTC, up sharply on the day. The Venom price prediction conversation is heating up again after a green candle broke months of losses inside a descending price channel. Momentum flipped fast.
But one number matters more than the daily gain: can $VENOM hold above its nearest resistance zone, or is this another failed bounce inside a bigger downtrend? Turns out, the chart gives a mixed answer. This piece breaks down price action, RSI, MACD, support, resistance, and where VENOM could sit between 2026 and 2030.
Quick Prediction Box
Metric | Current Snapshot |
Current $VENOM Price | $0.01724 |
24H Change | +62.19% |
Market Cap | $17.05M |
24H Volume | $1.36M |
Trend | Bullish (short term) |
RSI | 84.13 (Overbought) |
Key Support | $0.007591 |
Key Resistance | $0.026550 |
Next Target | $0.020 – $0.030 |
Bull Case | $0.026 – $0.037 |
Base Case | $0.012 – $0.020 |
Bear Case | $0.0075 – $0.010 |
Invalidation | Break below $0.007591 |
Venom Price Prediction 2026
VENOM Current Price and Market Snapshot
$VENOM sits at $0.01724, up 62.19% in twenty-four hours, per CoinMarketCap data captured at 09:22 UTC on September 21, 2026.
Market cap reads $17.05M. Unlocked market cap runs near $54.53M, since most supply hasn't hit the open market yet.
Volume jumped over 1,300% day over day to $1.36M. Thin, for a move this size.
Circulating supply stands at 988.91M $VENOM against a total supply of 7.36B and a max supply of 8B.
The 24-hour range ran from $0.01047 to $0.02454. The all-time high remains $0.7955 from March 2024, down 97.76% from there. All-time low, $0.007733, printed two months ago.
$VENOM Technical Analysis for 2026
The daily chart shows $VENOM trapped in a descending channel since April. Price just pushed through the mid-channel line.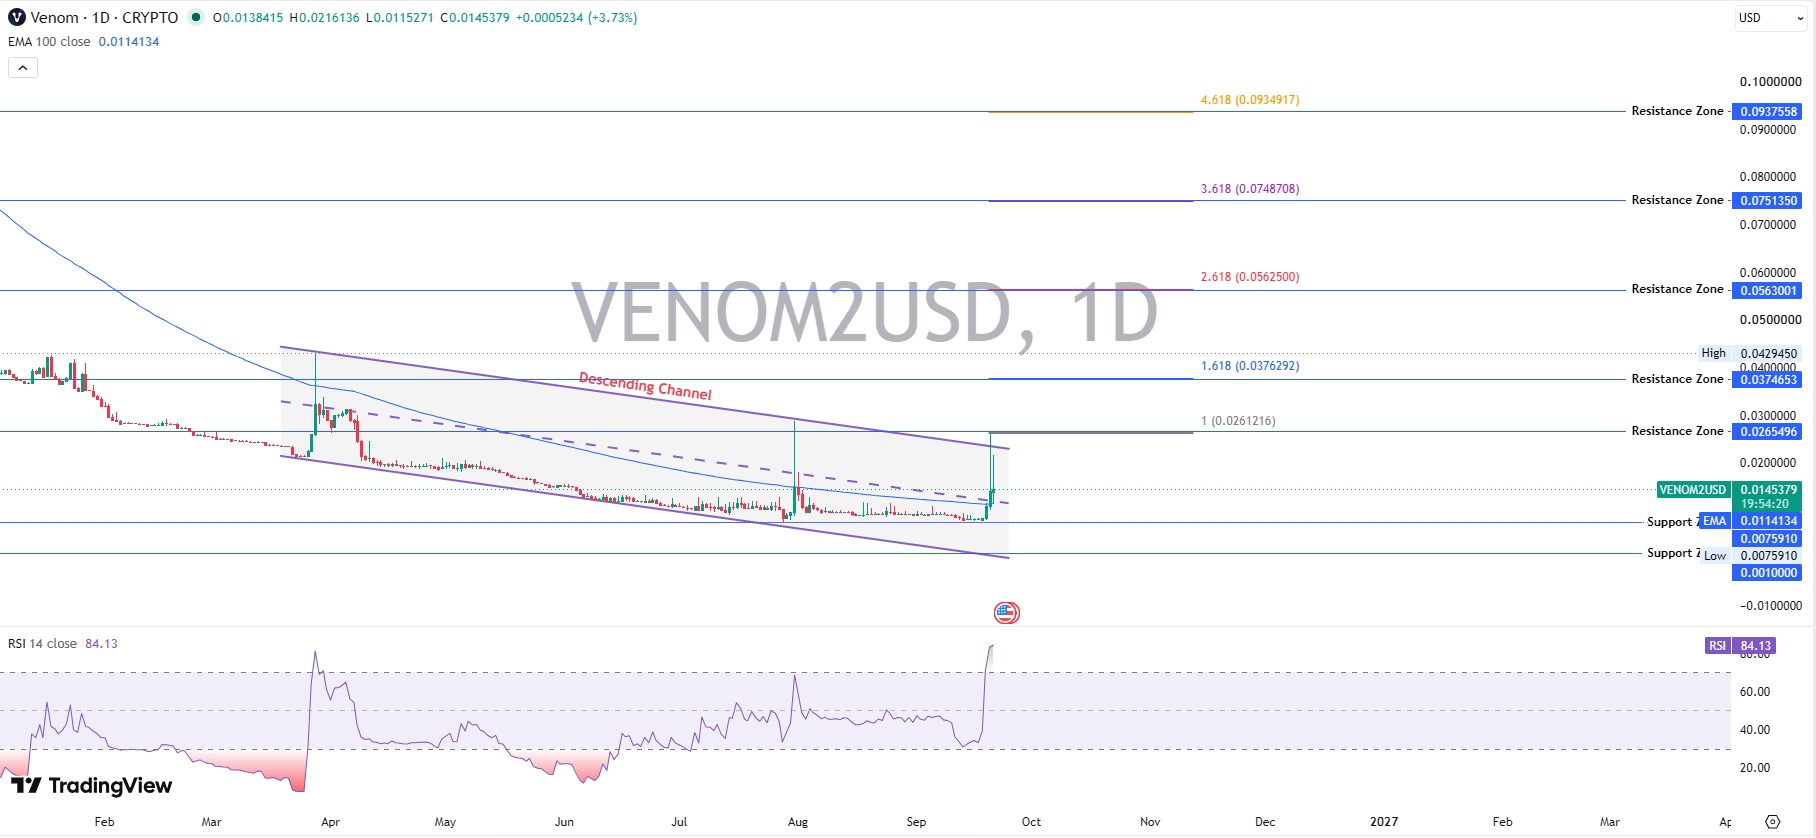
RSI (14) reads 84.13. Deeply overbought.
MACD tells a different story. The MACD line sits at 0.0008409, above the 0.0000384 signal, with a positive histogram. Bullish crossover, confirmed on real trading volume.
Price now trades above its 100-day EMA at $0.011413. Hasn't happened since April.
Venom Price Prediction for the Rest of 2026
Scenario | Price Range | Key Assumption | Invalidation |
Bear | $0.0075 – $0.010 | Support fails, momentum fades | Trades below $0.007591 |
Base | $0.012 – $0.020 | Consolidation, slow recovery | Loses $0.011 EMA support |
Bull | $0.026 – $0.037 | Breakout with volume follow-through | Fails at $0.026550 resistance |
More on near-term levels sits in the Venom price prediction hub.
Venom Price Prediction 2027–2030
VENOM Price Prediction 2027
Assume circulating supply grows toward 2 billion $VENOM as unlocks continue, tracked on the crypto events calendar. A $40M to $60M market cap implies a price near $0.020 to $0.030.
VENOM Price Prediction 2028
Supply near 3.5B by this stage. A $100M to $150M market cap implies $0.028 to $0.043, needing fresh exchange listings and deeper liquidity than today's $1.36M volume.
VENOM Price Prediction 2029
Supply near 5B. A $200M to $300M market cap implies $0.040 to $0.060, leaning on a broader altcoin cycle, not $VENOM alone.
VENOM Price Prediction 2030
Supply approaches 6.5B, closing on the 8B max. A $400M to $650M market cap implies $0.062 to $0.100, tied to AI-linked blockchain narratives pulling fresh capital toward Layer-1 networks.
$VENOM Support and Resistance Levels
Key Support Zones
The $0.007591 zone marks prior demand, where wicks reversed sharply more than once. Below that sits $0.0010, an extreme floor tested only once.
Key Resistance Zones
$0.026550 is the first wall, the top of the descending channel. Above it: $0.037465, a Fibonacci extension level. Then $0.056300 and $0.075135, tied to prior reaction highs. A real breakout needs volume, not just a green candle.
$VENOM RSI, MACD, and Trend Analysis
What RSI Says About $VENOM
RSI at 84.13 sits firmly in overbought territory. Pullback risk is elevated. But overbought readings during a fresh breakout sometimes mean acceleration, not reversal.
What MACD Says About $VENOM
The MACD line crossed above the signal line. The histogram turned positive. Momentum favors buyers right now.
Is $VENOM in a Bullish or Bearish Trend?
Combine the signals: RSI screams caution, MACD confirms short-term strength, and trades now sit above the 100-day EMA for the first time in months. One green candle doesn't erase a five-month slide. Call this a bullish pop inside a structure that's still bearish until $0.026550 breaks and holds. Is that likely this week? That question is what every $VENOM trader is chewing on right now.
What Could Drive $VENOM Higher?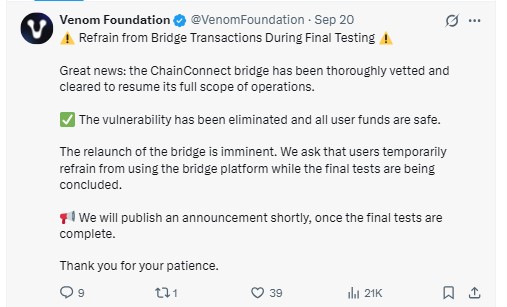
Ecosystem news helps. The Venom Foundation confirmed its ChainConnect bridge cleared a vulnerability, relaunch called imminent as of September 20, 2026. And a working bridge usually means fresh liquidity. Bitcoin's trend matters too, trading near $81,311.20, up 1.05%. Add exchange liquidity, new partnerships, and rising network activity, and the bull case gets real legs. Fine.
What Could Push $VENOM Lower?
Supply is the quiet risk. Only 39.54% of the total supply sits unlocked; 50.47% remains locked, waiting. A heavy unlock wave could flood the market, a pattern covered often in altcoin market news. Add a failed breakout, fading volume, or Bitcoin weakness, and the bear case writes itself.
$VENOM Bull, Base and Bear Scenarios
Scenario | Price Range | Market-Cap Logic | Trigger | Invalidation |
Bear | $0.0075 – $0.010 | Supply grows faster than demand | Support failure below $0.007591 | Recovery above $0.011 EMA |
Base | $0.012 – $0.020 | Moderate adoption, steady unlocks | Consolidation, slow recovery | Loss of $0.007591 support |
Bull | $0.026 – $0.037 | Adoption outpaces supply growth | Breakout above $0.026550 with volume | Failed breakout, rejection at resistance |
Can Venom Reach $0.05, $0.1 or $0.20?
Target | Required Market Cap | Required Gain | What Would Need to Happen? |
$0.05 | ~$49.45M | ~+190% | Sustained recovery past all major resistance zones |
$0.1 | ~$98.89M | ~+480% | Stronger adoption plus new exchange demand |
$0.20 | ~$197.78M | ~+1,060% | Full bull-cycle conditions across crypto broadly |
These figures use today's circulating supply of 988.91M $VENOM. Rising supply over time would push the required market cap even higher for the same price.
Venom Price Prediction 2030: Market Cap Scenarios
The math is simple, even if the outcome isn't. Price multiplied by circulating supply equals implied market cap. At $17.05M today, $VENOM needs roughly twenty-four times growth for the $400M bull-case cap and closer to thirty-eight times for the $650M end. Big ask. And not impossible over four years, given how much supply still has to unlock.
What Traders Should Watch Next
Breakout above $0.026550. Breakdown below $0.007591. RSI cooling from 84 without a price collapse. MACD histogram holding positive. Volume follow-through beyond this spike. Bitcoin's direction. Market-cap change against unlocked supply. Listing activity is tracked through crypto airdrop and listing trackers.
Trader takeaway: the breakout is real, the overbought RSI is real, and both can be true at once. Confirmation, not hope, decides what happens next.
Disclaimer
This article is for informational purposes only and does not constitute financial or investment advice. Cryptocurrency prices are volatile, and price predictions carry no guarantee of accuracy. Readers should conduct independent research before making any financial decisions.
32 minutes ago
I lost about $63k Bitcoin, I searched around and tried to work with some recovery firms unfortunately I was scammed as well. This happened for weeks until I came across recoverydarek (@) gmail (.) com They came to my rescue .



















