Gold, Silver, Crypto & Stocks Crash Together: Why Are Markets Falling?


Gold, Silver, Crypto, and stocks all dropped at the same time on Friday, October 30. Almost nothing was safe.
The crypto market cap sits near $2.59 trillion, down 1.37% in 24 hours. Bitcoin, Ethereum, and XRP kept seeing selling pressure.
One X user summed it up in four short lines: gold is crashing, silver is crashing, stocks are crashing, Bitcoin is crashing.
Rate Hike Bets Hit Every Market at Once
US PCE inflation rose 0.5% in September, the biggest jump since March. Annual inflation hit 3.6%, and core PCE reached 3.1%.
Growth is strong too. Q3 GDP rose 3.4% annualised, above the 3.2% forecast, helped by consumer spending and AI investment.
The Fed held rates at 3.75%-4% on Wednesday in a 10-2 vote. Both dissenters wanted a 25 basis point hike. CME FedWatch shows about a 70% chance of a hike in December.
Oil and the Iran War Keep Inflation Fears Alive
Oil was on track for a fourth monthly gain. An attack on a tanker in the Strait of Hormuz showed supply risks are still there.
Higher energy costs mean rates may stay high for longer. That hurts assets that pay no yield, like gold and silver.
Japan added to the worry. Core inflation in Tokyo rose well above the central bank's 2% target in October.
Gold Slips Below $3,900 as Bears Take Control
December gold futures (GCZ6) closed at $3,884.90, down 3.63%. The day's range was $3,879.42 to $4,038.20, and the 52-week range is $3,879.42 to $5,626.80.
Sunchartist flagged a larger head and shoulders neckline break, a bull trap near $4,700 to $4,800, and a triangle reversal. An earlier triangle had backed the uptrend.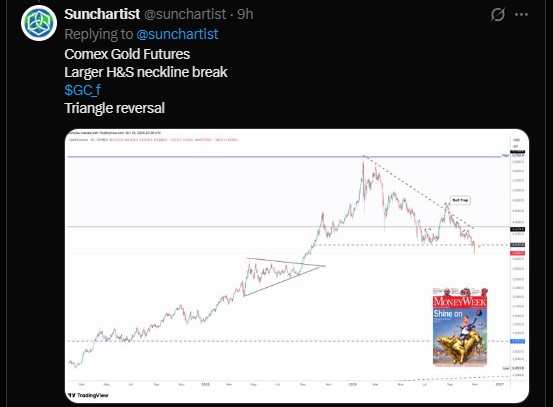
Gold broke the October 2025 low at $3,886. One analyst sees the yearly pivot at $3,829 as a likely intermediate low, though it may be undercut. That is an opinion, not a promise.
Gold level | What it means |
$4,280 | A sustained move above would improve the outlook |
$4,020 | Reclaim could spark a short-term relief rally |
$3,880 | Staying below opens more downside |
$3,829 | Yearly pivot, key support to watch |
$3,800 | Next support below |
$3,650 to $3,500 | Deeper correction zone if selling grows |
Silver Drops Under $50 for the First Time Since November 2025
Silver was hit harder. December futures (SIZ6) closed at $49.14, down 6.20%.
The day's range was $48.90 to $52.33. The 52-week range is $46.52 to $121.785.
That means silver has lost more than half its value from the peak. The chart shows a sharp turn lower after the January 2026 high.
Veteran trader Peter Brandt asked if someone would say "40s." He said it feels like traders who bought above $100 are now running for the exit.
Brandt added he has seen these washouts many times and is not in a hurry to buy the first short-covering rally.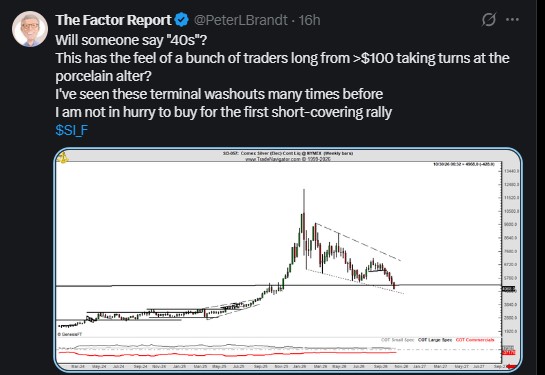
Other chart watchers see silver near the lower edge of a possible falling wedge. That is where selling can run out of steam, but it is not guaranteed.
Silver level | What it means |
$60 | Extended relief target if buyers hold |
$55 | First real sign of a bullish reversal if reclaimed |
$49 to $50 | Current zone, first break below $50 since Nov 2025 |
$45 to $40 | Possible downside zone if support fails |
Bitcoin Holds Near $77,000 After a Binance Scare
Bitcoin trades near $77,251, down 1.27% in 24 hours. It briefly touched about $76.4K after a report of a $6.3 billion security breach at Binance.
Ethereum is near $2,240, down 0.20%. XRP trades at $1.2435, down 0.92% on the day and about 18.7% for the month.
Watch the $76.4K low. A clean break under it could invite more selling, while a hold may give bulls room to breathe.
Coin | Price | 24h change |
Bitcoin (BTC) | $77,251 | -1.27% |
Ethereum (ETH) | $2,240 | -0.20% |
XRP | $1.2435 | -0.92% |
Long Traders Take the Pain in $400 Million Liquidation Wave
Crypto saw $400.85 million in liquidations over 24 hours. About 91,436 traders were wiped out, per CoinGlass.
Longs made up $308.73 million, or 77%. Shorts made up $92.12 million, or 23%.
Binance had the largest share at 50.7%. The biggest single order was $11.43 million on Binance BTCUSDT.
Asset | 24h liquidations | Long share |
Bitcoin (BTC) | $142.08M | 70.7% |
Ethereum (ETH) | $31.57M | 60.2% |
Gold (XAU) | $29.57M | N/A |
SNDK | $21.09M | 83.8% |
Silver (XAG) | $14.68M | 99.3% |
SOXL | $13.50M | N/A |
Solana (SOL) | $8.11M | N/A |
Silver stands out. Almost every liquidated silver trader was betting on higher prices.
Shorter windows show the pace slowing. The 12-hour total was $84.53 million, the four-hour total was $9.05 million, and the one-hour total was $1.48 million.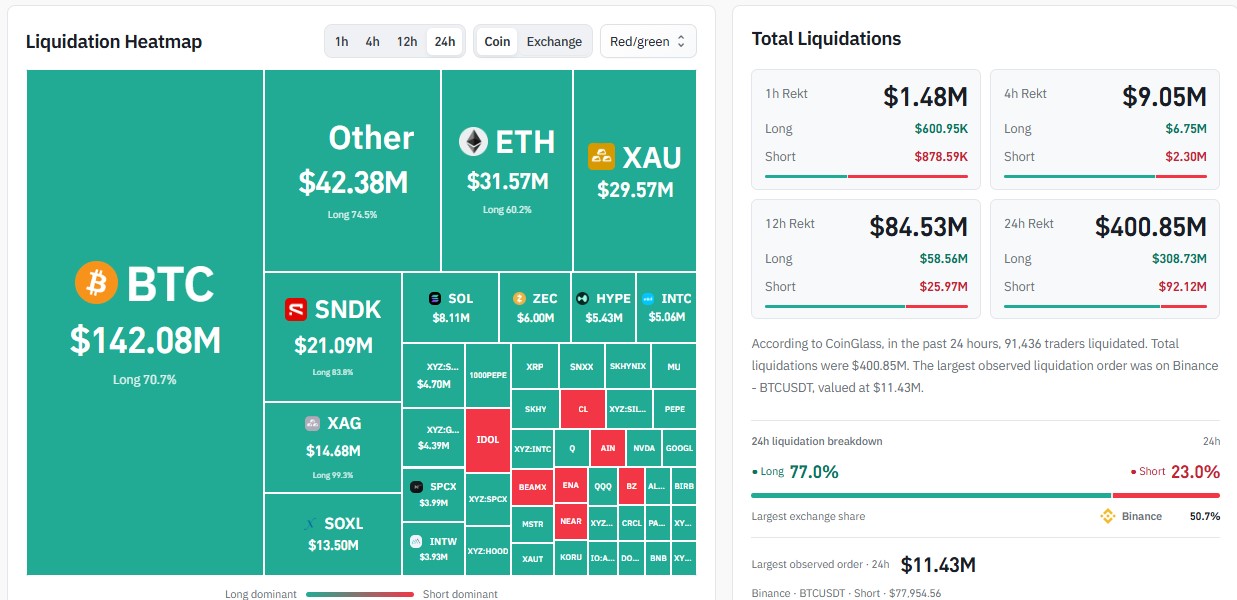
Nasdaq Suffers Worst Day Since June as Nearly $2 Trillion Vanishes
Nearly $2 trillion was erased from US stocks, slightly more than SpaceX's entire market value. Nasdaq is down over 5.8% in October as Meta, Alphabet and Amazon raise AI spending plans.
Intel fell 28.58%, flirting with its worst day since 1974. It beat profit estimates but gave a weak forecast for the final quarter.
Stock | Move | Stock | Move |
Intel | -28.58% | SNDK | -13.47% |
Qualcomm | -11.12% | AMD | -10.88% |
Marvell | -10.05% | Arm | -9.97% |
Seagate | -7.98% | Skyworks | -7.95% |
Applied Materials | -7.49% | Western Digital | -7.41% |
ASML | -6.55% | SpaceX | -6.37% |
Palantir | -6.27% | Lam Research | -6.01% |
KLA | -5.69% | Shopify | -5.63% |
Broadcom | -5.48% | Micron | -5.30% |
Nvidia | -4.22% | Crowdstrike | -4.10% |
Palo Alto | -3.86% | Cisco | -3.76% |
Microsoft | -1.55% | Meta | -1.53% |
Amazon | -1.41% | Alphabet | -1.40% |
Apple | -1.23% | Tesla | -0.87% |
Walmart | +1.86% | Costco | +1.63% |
Gilead | +3.06% | Netflix | +0.05% |
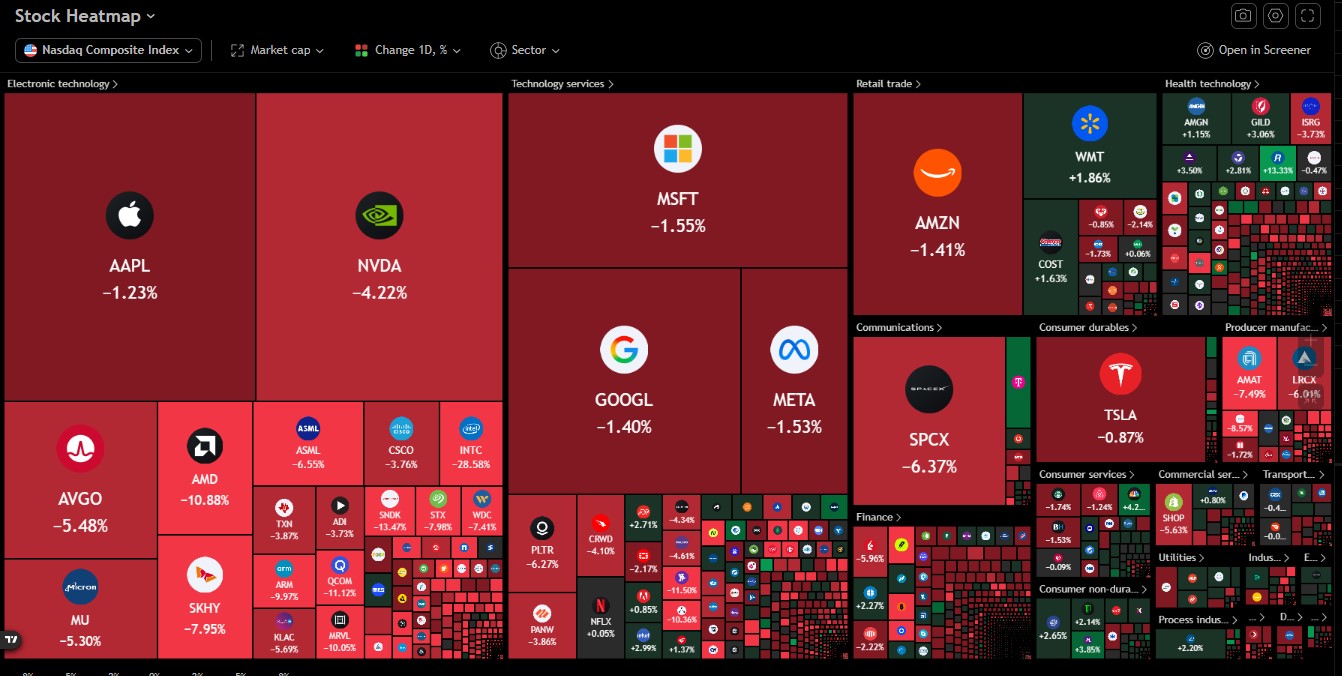
Money seems to be moving from tech to retail and some health names. Some point to the 2026 midterms election or the Binance scare, but neither is confirmed. Selling to raise cash looks like a bigger driver.
Nasdaq Futures Show a Possible Top
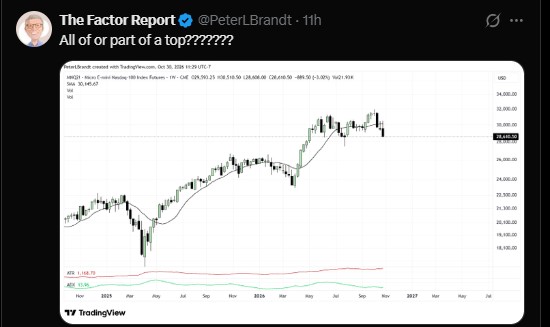
The MNQ weekly chart shows a shooting star near 31,000 to 32,000 and a close near 28,610. Brandt asked if this is "all or part of a top."
MNQ level | Meaning |
31,000 to 32,000 | Resistance zone |
30,150 | Weekly average, reclaim eases bearish view |
28,500 to 28,000 | Key support |
27,000 / 26,000 | Downside targets if support breaks |
What Could Come Next for Gold, Silver, Crypto and Stocks
Fear is high, and many levers point the same way. Inflation, oil, a possible December hike, and AI spending doubts all matter.
Some traders sell winners just to raise cash when stress hits. That may explain why gold, silver, crypto, and tech fell together.
If inflation cools or oil eases, relief rallies could appear. If not, the levels above may get tested again.
Nobody knows the exact path. Watch the Fed, oil headlines, and weekly closes before making big moves.
Disclaimer
This article is for information only and is not financial, investment, or trading advice. Crypto, metals, and stocks are volatile, and you can lose money. Price levels mentioned are analyst views, not guarantees. Do your own research and speak to a licensed financial advisor before investing.