Why Is Crypto Market Down Today? Are US Midterm Elections to Blame?


Why is crypto down today? The market is trading near $2.58 trillion, down 1.94% in the past 24 hours. The fallout from the Binance hack and nerves before the US midterm elections are weighing on traders.
Bitcoin slipped about 2% to around $76,851. Ethereum lost 1.70% but held the $2,250 mark. XRP fell 3.36% and is fighting to keep the $1.25 level.
Bitcoin, Ethereum, XRP Price Snapshot
Asset | Price | 24H Change | Level in Focus |
Bitcoin (BTC) | ~$76,851 | -2% | $76,599 (largest liquidation) |
Ethereum (ETH) | ~$2,250 | -1.70% | $2,250 |
XRP | ~$1.25 | -3.36% | $1.25 support |
Total Market Cap | ~$2.58T | -1.94% | n/a |
Why Is Bitcoin Down? Binance Hack and Long Liquidations
Traders were still shaken by the Binance hack, the largest ever seen in the sector. Sentiment had already been weak, and the hack pushed it lower.
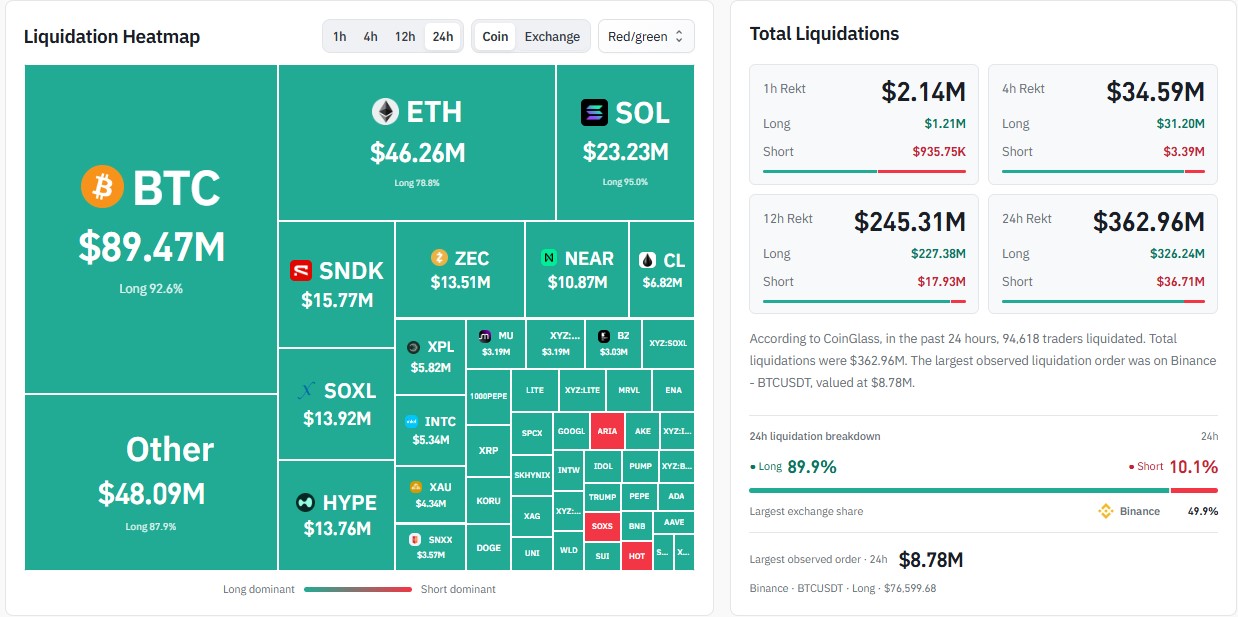
CoinGlass data shows $362.96 million in liquidations over 24 hours. That hit 94,618 traders. Long positions made up $326.24 million, or 89.9%. Shorts lost $36.71 million, or 10.1%.
Bitcoin led the list with $89.47 million in liquidations. Ethereum followed with $46.26 million, and Solana had $23.23 million.
Longs were hit hardest on Solana at 95.0%, then Bitcoin at 92.6% and Ethereum at 78.8%. Binance alone made up 49.9% of the total, about half.
The biggest single order was $8.78 million on Binance's BTCUSDT pair. It was a long position at $76,599.68.
Time Frame | Total Liquidations | Longs | Shorts |
1 Hour | $2.14M | $1.21M | $935.75K |
4 Hours | $34.59M | $31.20M | $3.39M |
12 Hours | $245.31M | $227.38M | $17.93M |
24 Hours | $362.96M | $326.24M | $36.71M |
Are US Midterm Elections Behind the Crypto Selloff?
Some traders think so. Polymarket bets show a 74% chance for Democrats in the Senate and 95% in the House.
Analyst Michaël van de Poppe says the fear is overdone. He believes the midterms are already priced in, and the Bitcoin dip reflects that worry.
He also noted that even a Democratic win may bring "calm," and years after midterms have often been strong. His advice was to "buy the dip" and stay patient.
History adds some doubt. Bitcoin fell 51% after the 2018 midterms and 25% after the 2022 vote. Will BTC drop again, or is this time different?
Nobody knows. Election outcomes can surprise, and markets do not always follow past patterns.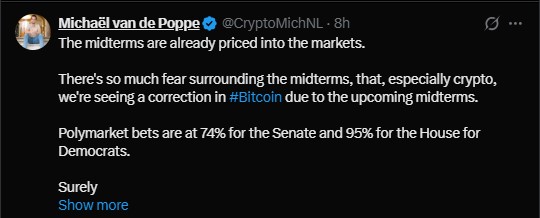
Fear & Greed Index Falls to 26
The Crypto Fear & Greed Index now reads 26, which is Fear. It was 37 yesterday and 48 last week, a Neutral reading. Last month it stood at 65, which is Greed.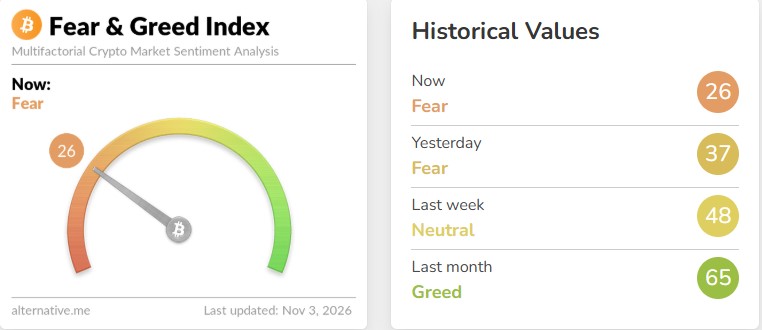
Santiment Data Points to a Possible Contrarian Setup
Santiment says sentiment has weakened for almost two months. Bullish comments have faded as prices fell.
Its chart marks the Binance hack as the point where the slide sped up. It also shows a FOMO zone, where crowds get overexcited, and a FUD zone, where fear takes over. Sentiment now sits near the fear side.
Here are the current ratios of bullish to bearish comments:
Asset | Bullish/Bearish Ratio |
Bitcoin | 0.69 |
XRP | 0.61 |
Ethereum | 1.14 |
Ethereum looks healthier than the other two. Still, its enthusiasm has dropped sharply since September.
A reading below 1.0 means bearish talk is louder. Extreme fear alone does not mark a bottom. But if BTC and XRP sentiment stays under 1.0 while prices stop making new lows, a relief rally becomes more likely. Fear plus price stability has often been a stronger signal.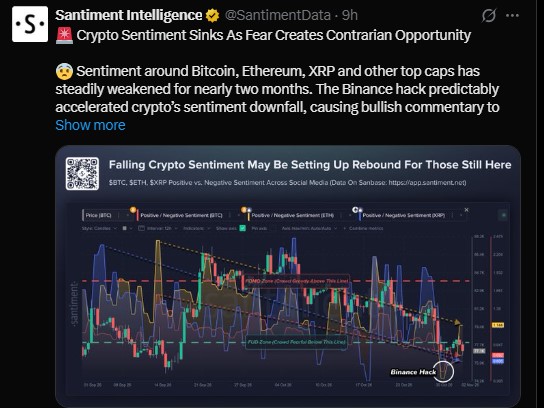
XRP Price Outlook: Bollinger Bands Squeeze Tight
XRP is trading near $1.25 after a weak session. Analyst Ali Charts notes that the 4-hour Bollinger Bands are at their narrowest since August.
The last time they were this tight, XRP rallied 71% in three days. A squeeze does not tell us which way price will go, though.
On the 4-hour chart, traders may watch $1.20 on the downside. Above, the $1.28 to $1.32 area stands out. A 4-hour close outside the bands could hint at the next move, but nothing is guaranteed.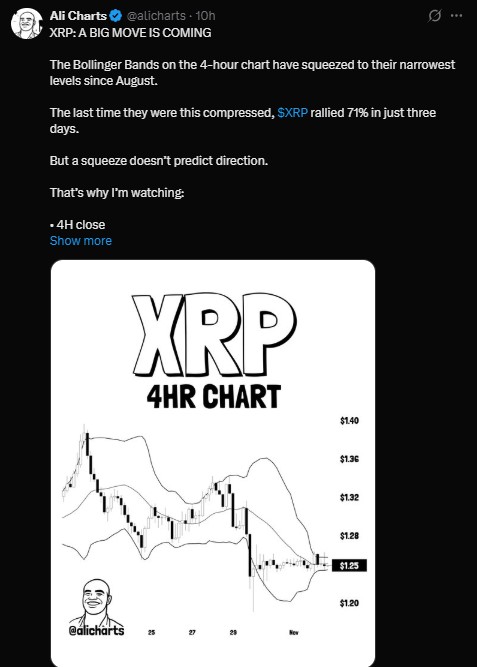
Ethereum Price Outlook: Key Decision Zone Near $2,287
One trader says ETH, near $2,287, is approaching a major higher-timeframe decision zone. He sees current levels as a decent entry.
His ideal accumulation zone is $1,800 to $1,900, where a bullish order block meets a fair value gap. He wants a liquidity sweep and bullish confirmation first.
If that plan works, his long-term targets are $2,700, $3,200, $4,400, $6,000, and $10,000. These are one trader's views, not forecasts, and ETH could move either way.
What Traders Are Watching Next
Bitcoin is holding near $76,851, and Ethereum is sitting on $2,250. If sentiment stabilizes, buyers may return. If the Binance fallout grows or election news turns messy, pressure could stay.
Disclaimer
This article is for information only and is not financial, investment, or trading advice. Digital assets are volatile, and you can lose some or all of your money. Prices and data can change quickly. Do your own research and speak with a licensed financial advisor before making any decision.